Tuesday, May 8, 2012

PCLN Looks VERY Weak

It' ironic that PCLN has held up better than a lot of tech stocks that look like they have a decent chance to bounce, yet the underlying trade is worse than all of those stocks. PCLN is looking very much like a decent short idea.


 PCLN's volume starts to show the weakness in the stock, on this 5 day chart the parabolic move is nearly almost always a sign of the end.

 These have been the best two places to short PCLN, if the tech sector rallies, PCLN could put in a new high, I would be looking to add on any such move, but rally any strength back toward those two area would interest me.

 Even on a short term basis, PCLN's 1 min chart doesn't look nearly as good as many others.

 The 2 min chart never even went positive, it was just in line and saw a negative divergence at the EOD.

 The same story with the 3 min chart, except the negative divergence was worse.

 Even the 5 min chart is the same, no signs of intraday accumulation.

 The 15 min chart is leading negative, it looks really bad compared to the rest of the market, yet price wise PCLN has held up better than the rest of the market. I would guess there's a decent market maker filling sell/short orders for some large funds.

 The 30 min chart looks worse than some other 30 min charts that already look bad, like AAPL.

And the 60 min chart is horrendous.

I have PCLN near the top of my list of shorts I want to add to, it's in decent position to add or initiate a position right here if you left enough room in your risk management to account for a move higher which looks like would only occur if PCLN floated with a strong tech move.

BIDU Update

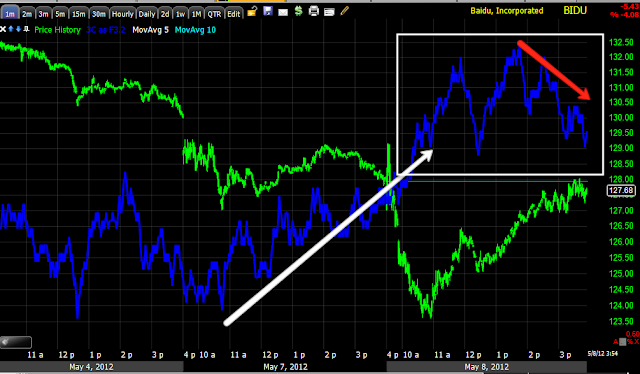
 I already have a short in BIDU, but would like to add to it on strength. The price pattern in late April suggested BIDU move lower, it did, this could be a head fake move to draw shorts in and then squeeze them, I'd like to add around the $145 level.

 Many of the charts incl. the 1 min have a positive divergence, but go slightly negative right at the gap fill area, this may be to keep shorts in place.

 The same is seen on the 2 min chart

 Even the 5 min chart starts to bend down at EOD and the gap fill.

The 15 min chart in BIDU would normally suggest to me the move below that small April consolidation was indeed a head fake move to trap shorts for a squeeze, since I feel confident in the long term assessment of BIDU, I will not be trying to trade around and instead hold my position and look to add to it on strength.

Lots of Hammers in the averages

A Candlestcick Hammer is a bullish reversal pattern, it shows lower prices were tested and rejected, it look like we'll close with these hammers, many after having taken out support levels making them higher probability and if the move comes off, more explosive as shorts would be squeezed.

 QQQ hammer after taking out major support and closing above it (thus far).

 DIA, a VERY long legged hammer on increasing volume

 SPY hammer and some former hammers, this one took out support and closed back above it.

IWM hammer, again took out support and closed back above it, this in its simplest form is a rejection of lower prices and a new support level.

Market Update

 The DIA looks the weakest of the 4 majors, this is the 2 min, leading positive, this is a pretty good signal, but seems it would suggest more of a "V" recovery if it holds, which is unusual, but with as many stops as have been hit, it is plausible.

 The 5 min has a long relative positive divergence and today is in line with price

 The 15 min looks like it should for the price decline in the DIA, it is slightly positive and leading today.

 ES keeps chugging away, volume is picking up

 IWM 1 min has been in line for most of the day, but is in a leading positive position.

 The 3 min chart has a long relative positive divergence and a leading positive that has built in to afternoon trade.

 I already updated the Q's, so the SPY 1 min is more positive than it has been is several days.

 The 5 min looks good here, leading positive.

This isn't the best 15 min chart, but it is still in leading position as it did not confirm the downside.

All in all, these signals look better than what we have seen the last several days, it may have just taken a big shakeout as I showed in a chart Monday that the amplitude of the swing is greater (like a broadening top). If Greek headlines don't go south and the Euro can hold up, I would say there's still a decent chance we get this one last move, as hard as it may be to imagine based on price, but considering volatility and amplitude, it's very much a possibility.

AAPL Update

AAPL still looks like it doesn't want to give in quite yet.

 1 min leading positive on the break of support today

 2 min the same

continues
 3 min shows the build up before earnings, the distribution in to earnings and a leading positive divergence

 The 15 min is where the magic is, it shows the same things the 3 min chart showed, but the 15 min keep climbing instead of confirming the downside price move.

Ultimately the longer term the daily chart is leading negative so I'm holding on to the calls for a bounce trade, but I have a longer term short position in AAPL that I will add to on any decent strength.

QQQ Update

Since the Q's were the first spot we identified some potentially bullish action, I'll update them first.

 QQQ early signs included a break below major support (the swings and amplitude as demonstrated yesterday are going to be larger) and volume picking up.

 You can see the market is responding directly to the Euro.

 1 min QQQ

 3 min QQQ

 5 min QQQ

15 min QQQ-this chart still is yet to confirm the downside move in the Q's and remains leading positive.

ES Continues to look good

3C is now at new highs on this chart, volume is picking up in ES, trade looks less tentative and the gap has already been filled. I believe ES is reflecting an expectation that the Euro will move higher, I already addressed the longer term or mid term concerns with this, but I'm just hoping for a decent quick bounce to add shorts to so the unresolvable problems in Greece don't really matter to much to my plans, but if the market feels a little better about Greece today and it wants to move higher, I'll take it.

UNG-1 of 2 Long Term long Trades

UNG has been a trade of interest, I believe a long term trend change is coming and today it is acting VERY well, up over 4.25%. I won't go in to all of the details of why I like this and in fact probably just post the charts in the interest of time.

 I have suspected the break below multiple support levels has been a major shakeout as UNG carves out a large base.

 Intraday this triangle did exactly what it should have.

 The 1 min chart is confirming the b/o

 So is the 5 min

 Since breaking support levels, UNG has shown good 60 min accumulation, the reason for the break of support in the first place.

 The daily chart is even leading positive

 Our daily X-over screen to prevent false crossovers has gone long.

Note the change in trend and volume, it looks like a secular trend change is underway in UNG, I like this as a long term trade. We'll get to looking at some individual names as well soon.


ES Update

 The 1 min 3C ES positive divergence keeps building.

 The Euro crossed above resistance and has pulled back a bit, it may be right at support as I may not have this trend line drawn perfectly.

CONTEXT is in line and mildly supportive of upside ES gains, this is due to a bunch of underlying factors like Credit, rates, Currency (a lot of the same indicators we use in the Risk Asset Layout).