Tuesday, July 30, 2013

Daily Wrap

I'm going to start tonight's EOD post the same way I start EVERY pre-F_O_M_C announcement (I even considered posting all of the times I have written this, but I think most of you know)...

Beware the F_E_D Knee-Jerk Reaction. Tomorrow is the F_O_M_C policy statement, for years there has been a trend of an initial knee-jerk reaction and it is almost ALWAYS wrong, usually being reversed within a few hours to a couple of days, it's just something I and others have noticed with such consistency that I ALWAYS warn before any major F_E_D / F_O_M_C event.

Sunday night I noted the volatility in the market last week when I was gone (almost all intraday) and I noted that ES (The S&P E-mini futures) was exactly where it was at Wednesday's 4 p.m. close as of the time of my writing late Sunday night, $1684. At 5:45 (now as I'm writing), guess where ES is? $1684.

For all the volatility and days that have passed, I find it odd that $1684 keeps coming up. If you put a daily VWAP on ES, it is currently at $1683.46. I'm not quite sure what to make of that, I doubt there's one super position being cashed out at a fill of $1684, it is likely more just a reflection of what stood out to me Sunday night after having been absent from the market for a couple of days, "no matter the volatility, the market is not moving much."

That brings up a couple of interesting charts, you've probably seen most of these (and keep in mind the VIX buy signal in our custom DeMark inspired indicator), but I figured they should be posted again as they really stand out to me, especially with this very recent range.

 MoneyStream doesn't give signals frequently and they aren't very detailed, it's kind of like my "Trend based" version of 3C which is below. What is notable here is the May highs and MoneyStream's position compared to the July highs and MS's position.

Although the trend version of 3C displays a bit differently, the findings are exactly the same, there's significantly less underlying capital flow in the market.

Remember the market breadth indicator I posted last night? The Percentage of all NYSE stocks above their 200 day moving average? I post these breadth indicators every once in a while in a major post, what struck me is as I updated my Telechart system after the close, I saw a note from Peter Worden which I almost never read and he had referenced the divergence between the NYSE and the same indicator I posted last night, I found that to be ironic, but both of us were looking at the same weakness in the market. I see those readings as proof the carry trades were closed earlier in the year and continued, he just noted the divergence.

Something else I found interesting was a couple of charts that I don't have access to, here's one which is the case we've been making with retail sentiment updates vs. 3C charts....

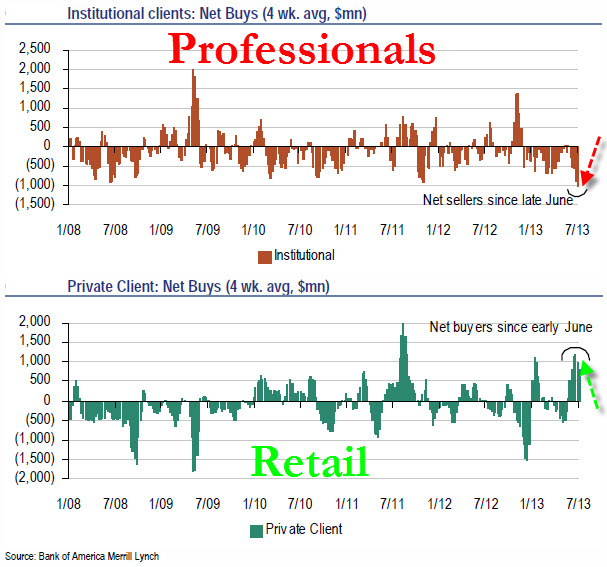
This is the difference between Institutional positions and retail, institutional are net sellers as 3C depicts and retail are net buyers as sentiment indications depict. I also find it interesting that I identified November 16th (and the area just before) as the start of large carry trades as well as 3C accumulation for what I called the start of a "Cycle Up" and as we know from 3C, institutional money Sells in to price strength, they have to because of the size of their positions, take another look now at the last time Institutional money were net buyers and how the net selling has progressed.

This brings so many things to mind such as identifying the change in the F_E_D's tone as soon as they announced QE3 in September, as I wrote way back then, "It almost seems as if they are looking for an exit" and then everything they did since then moving closer to that direction until they finally said it, we had been making the argument 6 months before they actually hinted at it.

Also the difference between the charts above from May to July highs and how 3C can't differentiate between a sale and short sale as both come across the tape as sales. The collapse in credit earlier this year, the EXTREME dislocations in Leading Indicators, some of the largest 3C negative divergences I have seen going all the way back to the early 1900's, the Market Breadth Indications which are horrible and I could go on and on.


As for some SPY charts

 Take a look at the 15 min which is a great timeframe for good signals and details. You may recall the post I put up regarding how many things changed right around July 8th as if Smart Money learned something shocking, I did an entire post on this, but one of the things that stands out in my mind was how accumulation in a carry trade was just finished and before it had a chance to make a dime in stage two, it was immediately and acutely shut down like an on/off switch which is hard to do with positions of that size.

*This is also about the area I expected a shorter downtrend to start and then be followed by the strongest up trend we had seen that would change sentiment which would precede "The Downtrend" we have been waiting for. Right around the 8th, everything changed and even signals showing the market was about to turn down were suddenly abandoned as if there was no time for it and the trend continued to the up trend we expected next. Even the size of the initial accumulation for the shorter up trend was right, it was way too small for the size of this one.

 Zooming in on the same 15 min chart we see distribution in large size and there's the accumulation at the 11 a.m. lows on Friday, as I noted Sunday night, there has been negative divergences/distribution in to any form of price strength, whether a green close or a nasty 150 point a.m. drop followed by a recovery to +2 points on the day. Any kind of price strength saw the same negative divergences/distribution to the point that it was a clear trend.

 This 5 min chart zoomed out looks much worse than it does here, but I'm trying to show where distribution became extreme and the flat zone, recall ES $1684.

This is a 1 min intraday chart of the SPY today, HYG (Credit) has been VERY interesting as it seems to be the sole leg the market stands on, later I'll post HYG charts and please remember to look at the intraday HYG chart for today around 1:30-2 p.m. at the market intraday lows.

As far as tomorrow goes, the closing divergence in the SPY is clearly negative, this usually carries over to the next day, even over weekends.

Credit has been very interesting to me, as you might know: HYG credit, TLT (treasuries) and VXX (VIX futures) are the 3 SPY arbitrage assets often used intraday to manipulate a market. Because I believe there's something much larger going on in treasuries, I think they are much harder to manipulate, the same is happening with VIX futures, but because Credit already saw a mass exodus earlier in the year, it seems to be the one asset that can be used and that is HYG.

I still find HYG's trade to be interesting and surprising to some degree.
 This is the 5 min positive divergence in a flat range I noted in HYG, at first I thought it may fire to the upside and support the market which seems to be struggling lately without the extra help, now I wonder if HYG can make that move at all.

Credit (HYG being the most abundant) does lead the market and 3C leads assets like HYG, in orange on a 10 min chart HYG sees distribution, in green HYG breaks slightly ahead of the SPX in light blue, the red area is 3C distribution in HYG. The other interesting part is the 5 min HYG positive, but there's no sign at all on the next timeframe of 10 mins, in fact it's quite ugly.

 The 15 min chart is even uglier right now, you  can see highs from June in HYG pulled lower on a negative divergence, then a positive divergence right around the 21st of June, which is you read the posts for the 21st of June in the archives, you can see we clearly identified this as an accumulation/reversal area and took long positions, this was 1 day before the final low.

This is the 1 min HYG intraday chart I asked you to remember in reference to the SPT 1 min chart around 1:20-2 p.m.

First last night in this post I showed several charts that suggested we'd see early strength (gap up) in the market today, one of them was this 1 min positive divergence in HYG yesterday . Then today as the market started to lose its footing, it's a positive intraday divergence in HYG that turns HYG and the market intraday.

As far as other credit today, JUNK (High Yield) Credit usually trades almost indistinguishable from HYG, today Junk Credit continued to slide hitting new intraday lows for the last week or so.

Here's the second chart I don't have access to, but found VERY interesting.
In orange we have "Credit Implied Volatility". The taupe colored areas on the chart are times when the F_E_D has no QE or other program running, note the spike in implied volatility (orange) during those periods, now look to the right and note the recent spike in C.I.V. , it is acting as if it expects the F_E_D to either begin to taper or end QE almost immediately.

As far as some other indications, commodities as a risk asset have not held up well recently.
Commodities lagged the SPX (green) since the 22nd of June (start of the run), however they really started lagging badly around mid-July, this cannot be blamed on the $USD.

As far as our Sentiment (Leading Indicators) go, FCT was worse today than yesterday, but still not horrible, except on a bigger picture basis which I also showed in last night's post. HIO is the same on a larger picture basis, intraday HIO was pretty close to in step with the SPX, however the market's bounce off the early afternoon lows saw HIO not participate in that move ending the day on a worse note.

There are quite a few assets I still want to look at and a lot of futures. I did want to show some of the positions from today as concepts, not individual trades, for instance last night I told you about MCP and what we'd be looking for including a move below the bear flag which should see an increase in volume  and clear 3C accumulation, we saw the first two things, but not the 3C accumulation. MCP moved higher and at first it felt like, "I missed the trade", but we stuck to our discipline and were right for doing so as MCP closed down -1.4% so it is the concepts I want to highlight, not the good decision not to start a call position.

VXX was another,  in this post  I outlined exactly what I expected from VXX to open a long position/call position today including the following...

"the only thing holding me back right now would be looking for a head fake move below that triangle"

This is something we see 4 out of 5 times before a reversal, I jumped the gun a bit early, although I think the position will be fine as there WAS the accumulation on the head fake move that MCP did not have, but it is the concept that we follow that showed again to be the correct way to enter the position.

The trailing stops for URRE yesterday could have saved you quite a bit in profits today, but it is the re-entry in URRE long that I believe will come that is the concept I'd like to share with you. 

I'll try to get these and more as well as other positions up for you, the concepts are the most important as they can serve you in just about any asset in just about any timeframe.


Filling Out TLT Core Long Position

This is really an asset I'd love to buy for my mom or something like that, but I like it and have liked it for quite a while because I see something there out of the ordinary, last night the Treasury's estimate of funding needs was 30% lower, that alone  is likely one of the causes of the underlying signals I'm seeing, the fact that banks are at unrealized losses on their Treasury holdings and how the F_E_D must react to remedy that situation is another reason.

I often say with 3C we get a signal, but by the time we understand why, the money has been made and it's too late. In this case it seems the reasons are right there in front of us, there seems to be a large, very quiet accumulation effort and yet more people are bearish TLT.

The only thing I don't like is the low beta, options aren't really an option as the market for TLT is so thin on the call side and shorting TBT to get leverage doesn't seem to be a good longer term strategy, you know how hard it can be to find and keep those borrowed shares so I'm going to just fill out the core equity TLT long right here.

I have posted plenty of charts, but after the close I'll post the intraday charts that made me decide to fill out the position today.

Market Update

I'll have to look through a few more assets to see what is pushing this, I believe HYG is still a player, but losing influence fast.

If I were capable of moving the market and had a pretty good idea that the F_O_M_C policy announcement tomorrow would not be a happy one for the market...

And lets not forget it was something like 150 hedge funds and private equity firms that were EMAILED the F_O_M_C minutes almost a day and a half early before their official release...I didn't even know that the F_E_D catered to smart money by emailing them the minutes whether early or even at the proper time,  so that should tell you something about how even the playing field is....

I'd be looking to send the market as high as I could, "Buy the rumor/Sell the news" type thing.

In any case, the point of the update is that several of the averages and Index futures look like they'll try to get an upside bounce going and that's pretty typical running in to an F_O_M_C policy announcement day. The more information I can gather in leading indicators and such, the better idea we'll have of the staying power, probability and what to watch for and how to use it.

In any case, here's a a quick overview of what I see right now.


 DIA 5 min, this isn't a huge divergence, it is really borderline as to whether it will make it or not, but it's there.

 The next timeframe at 10 mins shows what has been happening to any strength (as discussed within the context of "strength " being a VERY relative term right now) in that this is a clear leading negative divergence, also note the positive divergence that has fed this area of action from the friday 11 a.m. lows as mentioned several times since Sunday night.

 IWM has not looked good in most timeframes, but as I said earlier, it's still possible the IWM rotates in for a bit (as mentioned in the QQQ update today) and this 10 min positive is similar to the DIA's above.

 The Q's have seen continued distribution on price "strength" today.

The SPY 3 min chart is working on a positive divergence, this looks like an end of day ramp to get a green close.

While the longer term and much more important SPY 5 min has a significant leading negative divergence. I'll try to discuss what this means for newer members, but there are links on the members' sit, "Understanding 3C" that will help you understand multiple timeframe analysis.

The ES 1 min and TF (R2K) futures are also positive intraday 1 min.

Quick URRE Update

Yesterday I posted an update for URRE after another +28% one day gain for more than a 100% move in about 7 days.

The gist of the post was to get a trailing stop in place, I suggested a 50-bar 5 min stop or even better my Trend Channel which held the move up with a stop at the moment (yesterday of $4.95, that stop was hit yesterday and would have left you in much better shape than today's -16% decline).

The gist behind this post is that 1) I still love URRE as a longer term long position, 2) there will likely be some choppy volatility in the area and 3) In my view, URRE needs a decent pullback with strong signs of accumulation in to that pullback before it is ready to make a second leg similar to the first.

A 1-day pullback in my opinion is no where near enough to sustain a second leg like the first one we saw, you may get some volatility in the area, but I would probably be looking for URRE to pullback to a 10-day to 22 day moving average (probably in the area of $4.00 by that time)  before it is ready to make a new run higher.

I'll try to get some URRE charts up tonight so you have some idea of what is typically reasonable using the Trend Channel and X-over Screen.

Like I said, with this kind of volatility in this stock, a bounce in the area very near term would not be surprising, but I would not be fooled in to believing it was the start of a next leg higher.

GS Update

GS has been an excellent Bellwether asset for the overall market, it has been, up until recently, a strong stock.

In addition to a GS update, what I'm also trying to get across is that some assets will make for better trades now than all of them turning at once with the market, there is rotation among sectors and individual stocks, but the most important thing is a high probability entry and a low risk position that is timely.

Yesterday I showed how TECS (long) a couple of weeks ago was the best entry even though the broad market had not flipped yet.

As far as GS right now, I already have an open core short equity position that doesn't have much room to add to, however I would not be opposed (in my particular circumstances) to a GS PUT position "If" it was set up beautifully which it is not right now. However if I was looking for an equity (not an ETF) financial short (This would be the reason I'd prefer an equity short over an inverse ETF for a longer term position, "Making More Than 100% in a Short" which is something you can't do with an inverse ETF as it is actually a long position), I would not be opposed to either entering GS in this area or better yet a phased in entry in 2 to 3 positions if the transaction costs and your time do not make that impractical.

*Before entering any phased in position in which the idea is to add at better prices, you MUST account for this entry in your risk management BEFORE ever entering the first share, otherwise you are just dollar cost averaging which is never a good idea in my view.

The reason I can withstand a GS short equity position over a leveraged Put position right now has more to do with timing, but for an equity short it also has to do with pretty minimal risk at this stage.

 Intraday (1 min) something changed rather quickly in GS, from an intraday positive yesterday suggesting GS see some higher prices which is one of the reasons GS hasn't been presented as a short position or put position yet, to something pretty ugly, but still VERY near term on a 1 min intraday chart.

The GS 2 min chart shows the same thing so the 1 min chart doesn't seem to be a random fluke.

The 3 min chart shows the same positive divergence yesterday, but has less damage today than the faster 1 ands 2 min charts, this is why I haven't put GS out as a specific trade or position as of yet. It may be the 3 min chart just hasn't seen migration from the 1 and 2 min charts yet, however I suspect that those were more of an intraday move and GS still has a decent chance at some more upside which would make for a better entry.

 The 5 min chart shows a little of that accumulation yesterday afternoon, but it's nowhere near as strong on this more important chart so it does look like a short term upside move which is what we are looking for as far as higher probability short positions.

The stronger distribution in red may also already have the head fake move in place, although with the positives from yesterday GS has just about enough gas in the tank that it could challenge that last high.

However even if GS were to challenge thAt area, the risk is still fairly limited, MAYBE 5 POINTS OR SO which is about 3% or so position risk and much less than 2% portfolio risk so long as you use some form of halfway decent risk management. THIS IS THE REASON I'M FAR LESS OPPOSED TO A GS EQUITY SHORT HERE RATHER THAN AN OPTIONS PUT.

The longer term picture in GS had been too strong to seriously consider shorting, but now it is in that range where it is definitely worthy of consideration as the 10 min chart leads to a new negative low for this entire cycle.


Jumping to the much more important 2 hour chart, you can see a larger accumulation area to the far left, a much smaller one at the June 21st area, a distribution area to the left and a much stronger leading negative divergence to the right. Clearly GS has seen dramatic deterioration which is what we have been waiting for.

I'll try to keep on top of this one, but the overall market, the arbitrage assets, leading indicators and sector performance will also have a lot to do with timing in any individual asset.


Went With VXX Aug $15 Calls (expiration 8/17)

Also Adding to VXX /UVXY

I'm going to be looking at "In the money" Aug. VXX calls, but I also like VXX or UVXY long equity positions at this point.


Went With QQQ August $74 Puts (Expiration 8/17)

Opening a QQQ Aug $77 Put

I may look at September as well to see what the premium and liquidity look like, there's nothing special about $77 other than it's in the money where I prefer to be.

For an equity position (Short the QQQ/NDX) there's the 2x leveraged short QID and 3x leveraged short SQQQ.

I may look at entering/adding to those positions, but for now I'm most interested in a QQQ put position as I have no open Index options.

Additional charts will be coming.

Q's Still Looking Like the Most Interesting Asset

Yesterday I posted this "QQQ Update" , the gist of the update was the following...

"The IWM started showing some pretty nasty distribution intraday today as I posted around 3 p.m., but that doesn't necessarily mean its the best entry. The topic of a lot of discussion the last week or two has been weighing the best entry vs. micro-managing the entry too much and missing the forest for the trees which is usually not that big of an issue, but when a market starts acting like this one has been, it becomes more of an issue and that's why I'm pointing out intraday action like the IWM and QQQ today.

I'll cover the market a daily wrap, but I thought you should see the Q's."

I had an email earlier asking if the Q's still looked like the best short entry (at the proper time) based on charts such as those posted Sunday night and yesterday more specifically. I'd say the Q's are still the most interesting of the 4 averages as of right now and that's not just because of their relative performance vs the other averages (less risk), but it does have something to do with the position the Q's are in, not only filling in the 7/19 gap, but moving above that area which sets up a possible (in this case, very probable) head fake move which gives us better timing, a better entry and less risk.

That being said, I'm not ready to rule out the IWM specifically or any of the averages making similar moves, but as far as what we have now, here it is (*This is not a full market update or really a market update at all in the regular sense, it's showing probabilities of a position and what we look for).

 SPY 3 min still has that positive divergence formed at the 11 a.m. lows of last Friday, it still has a little gas in the tank so the SPY "Could" make a move similar to the
Q's, but as of now, it hasn't and we can only make the best decisions we can with what we know, not where we guess an unknown asset will be at an unknown time and date.

 For the SPY to make a similar "Head Fake" move or in this case more specifically a "Bull Trap" (Please read the two articles linked on the members' site- UNDERSTANDING THE HEAD-FAKE MOVE- so you understand why these moves are important, why they occur and how we can identify and use them to our advantage). it would have to move above the yellow trend line. While the 3 min chart still has some gas in the tank, the 5 min chart does not, this is why I believe HYG was recruited,  as shown Sunday night, to help the averages along on an arbitrage basis.

 The IWM 3 min chart doesn't look like a high probability candidate to make the same move as the Q's, although it still can, most of the moves in to any kind of higher prices at all have been sold in to as you can see.

The QQQ by contrast is showing a very deep leading negative divergence in to a nice move to the upside, being the best relative performer on the day.

This is the head fake area or "Bull trap" area where retail will buy the Q's on a "Breakout" move, the 15 min chart shows acute distribution on the move above the former resistance zone. This makes the QQQ a VERY high probability bull trap, which falls under the broad category of "Head-Fake" move.


Volatility

Here's the VIX / VXX / UVXY charts I promised in the last post. As you know, our custom indicator that is loosely based on some DeMark principles, in the past has given us some excellent buy/sell signals and specifically with the VIX. As you know we just had a buy signal last week.

Here are the charts, as well as the reasons why (in these assets alone) it's getting hard to ignore them, even though there are some open positions already and a few underwater pretty deep, a few not so bad, but the VXX/UVXY options can move VERY fast in my experience.

In any case, sticking with our normal concepts the VXX and UVXY both have consolidation/continuation triangles, whether you draw them as bearish descending wedges or the symmetrical triangle that has no bias except for the preceding trend, in both cases Technical traders view both as bearish which sets up a head fake move which is something we'd expect to see 4 of 5 times any way, that's our best entry. 

I'd say, if you have a very high standard and can get through a trading day without saying, "I should have...","I wish I had...", "Why Didn't I?" then waiting for the typical head fake move below the triangle with 3C confirmation is by far your highest probability move.

That said, the probabilities are already VERY high for a strong upside move in both and I'd say EXCEPTIONALLY soon.

 The last buy signal from our custom Buy/Sell indicator, which is just a true/false indicator with a set of conditions that are loosely based on DeMark principles and give amazingly similar signals, sent the VIX up about +55%.

This is the 15 min VXX chart which shows a very typical reversal process price pattern that is in scale or proportion with the preceding trend, to the far right is the triangle of the last several days which is often a signal that we are VERY close to a directional move, most often Technical traders are used as these very well known price patterns are used against them.

This is the very big picture 2 hour 3C chart,  I show it because not only does it show the degree to which we have an exceptionally strong leading positive divergence, but it shows a near picture perfect divergence in the exact right place with the right price pattern.

I also show these for confirmation as VXX is managed by I-Path, UVXY is not only a 2x leveraged version of VXX, but managed by ProShares and XIV is a 2x leveraged INVERSE of VXX and managed by VelocityShares. In other words, from 3C's perspective, these assets have NOTHING to do with each other, the only way there is a similar signal between all 3 is if there actually is a similar signal between all 3.


 This is the 2 hour UVXY that looks nearly EXACTLY the same as VXX.

This is the 2 hour XIV which is the inverse of VXX w/ 2x leverage so the signal should be the mirror opposite which it is.

 I was looking at an intraday view of a 3 min chart and it looks to me like this triangle was engineered, the steering currents on a 3 min intraday chart not only form the triangle, but give last min accumulation signals.
A head fake move would almost certainly be BELOW the triangle's support, it should trigger volume and it should see 3C move higher before it breaks out to the upside on the move we'd be looking for.


 Amazingly UVXY in the exact timeframe has nearly the EXACT same 3C signals.

This is UVXY intraday, the point is, as we are seeing a downside intraday price move in these assets, we are seeing the stronger positive divergence I'd hope to see.

In my view if we get a picture perfect head fake set up, then I'd say a VXX call position would be warranted, but I'd also like to have or add to UVXY equity long exposure for a slightly longer move than we'd normally take with options.


VXX / UVXY

I'll have an update out for you soon, HYG overlaid over the SPX today shows quite clearly how HYG's arbitrage value was used today, but otherwise the SPY arb from TLT and VXX seems to be about nil.

It's getting very hard to justify not taking on some exposure or additional exposure in VXX or UVXY long; even the price pattern is a clear accumulation pattern, the triangle that is formed over the last several days looks very obvious as well, the only thing holding me back right now would be looking for a head fake move below that triangle, but with the Buy signal in our DeMark inspired custom indicator in the VIX that has been very accurate, especially in the VIX,  it's a matter of weighing the best entry vs. missing the move at this point and most of you know I'd gladly miss a move as there's always another in favor of patience and getting the best signals, but this is a different level of play.

Update

In a few key areas there's some decent movement, for example the averages are showing some good movement, HYG as I posted last night, was able to fend off deterioration and create a short term positive divergence that I thought would move higher today, thereby supporting the market which it is.

MCP is working as I suspected it might, but it just doesn't have the divergence I was hoping it would have, maybe it will later, but without that, it's hard to trust that the move there won't suddenly fall apart in an instant.

There are still a lot of areas with virtually no movement and I don't think anyone would be surprised with the F_O_M_C underway today and out with their statement tomorrow, unless there's a leak or some other information, that's something we are looking for, so far it's pretty quiet.

Here's a sampling of the averages in the timeframes that are useful at 10:30 in the a.m., they look as I suspected and without MCP showing its own positive divergence today, it's hard to trust it with the market averages looking like this so far.

 DIA intraday 1 min example, no confirmation of this morning's price action at all, in fact the opposite.

The same with the IWM 1 min (really all the charts from 1-3 min look the same, I'm just not posting  12 charts).

 QQQ 2 min is leading negative so it's very far from confirmation and in to distribution as I suspected based on the tone of recent trade.


SPY 3 min and the original positive fueling any upside which came from Friday morning lows, on the open though the 3 min chart is not confirming and I'd say pretty close to distribution.

HYG showed this deterioration that was saved late day and turned to a positive divergence, I figured HYG would be higher today in support of the market, it is, but it's not any better than in line on a 1 min chart.

In essence, HYG is the jump-starter for the market right now.

This is MCP  which already had a number of short term positive divergences, but the move today below support should have given a very clear signal, without it the leveraged trade is very ex[posed, especially when the under-currents in the market are this fragile.

I'm looking at positions on the watch-list that I think will make good trades, yet again, whether it's too early or there's just not a lot of activity in front of the F_O_M_C,  there's very little movement or what is for us, a strong edge...at least as of this first 90 minutes of trade.


Opening Indications

It's a bit early to take much away from a.m. trade, but in all 4 of the major averages, in all 3 of the intraday timeframes thus far, there's not one that is confirming the gap up, everyone in all 3 intraday timeframes is negative which is also what I was expecting to find, distribution in to any strength.

Like I said at the start, it is very early to make a call on this based on a.m. trade, but it is a pretty solid indication so far so I'm going to look at individual assets.

MCP Update

So far MCP has completed the first part of what I'd want to see for a trade there today, a move below the bear flag that hits stops (creates volume), now the second half as I laid it out last night is evidence that those hit stops are accumulated, then it's time to make a call on the position.

Here's what we have so far.

 This morning's break below the bear flag which was the obvious part...

Next we need to see some confirmation that those stopped out shares were accumulated,  I drew in a blue arrow of what that might look like, but it could look a lot of different ways.

If we do get confirmation, I'll be looking at Aug. $7 Calls.

Pre-Market

Last night I thought the $AUD might participate in sending the market higher TODAY or at least part of it, but RBA Governor Stevens said Q2 inflation data retains RBA's scope to ease and that the AUD drop makes sense and that it is no major surprise if it falls further and fell further overnight it did, yet we are still gapping up, so I guess all of those other little indications taken together were more than enough, this has nothing to do with overnight action. this likely is all about pre-F_O_M_C action, get what you can, while you can.

That being said, it's movement, movement is good, it allows us opportunities and good analysis. I'll be looking for distribution of higher prices as we have seen a continuos trend of recently or confirmation of them, I suspect I'll find distribution, if so, we'll be looking very closely at the stocks that have the best risk / reward profile.

So far we are exactly on track from yesterday's analysis.

MCP is on the early radar.