Today's gap up can be attributed to a few things, the most obvious was the extreme decline in the dollar overnight, as you can see by the chart below. During US market hours, the Euro began retracing the rally.
The red arrow shows the Euro's overnight strength vs. the dollar. Right now the markets are largely correlated to the dollar, so the dollar weakness had a lot to do with the gap up.
Last night I reminded you of the Fed effect, of which we saw none yesterday, but I do believe we saw some of it today. As I pointed out, the dollar/market correlation is very strong, but as the Euro retraced, the market did not. This can be possibly the Fed effect and probably has something to do with the low accepted to submitted POMO operations today which I pointed out last week, usually lead to a close higher. Higher ratios usually lead to weakness in the market. So we have 3 different forces working together.
The Fed's move to bolster the stock market, thereby enriching Americans, combined with low to no yields in less risky assets is supposed to get Americans spending money and investing (as we have seen recently Americans are exiting the market every week for 6 months straight now according to mutual fund data). That means at least 81% of Americans have no exposure to the stock market, which in my opinion means the Fed's rationale for QE2 is totally bunk and as always, leads to the Fed's law of unintended consequences.
The Financial Times ran this story http://www.ft.com/cms/s/0/981ca8f4-e83e-11df-8995-00144feab49a.html#axzz14MBR0wSe
Emerging market's central banks as well as developed economies roundly criticized the Fed's debasement of the $USD-these are the currency reprisals that will most likely lead to currency wars and protectionism-the collateral damage or unintended consequences of the Fed's largely useless action Wednesday.
On Thursday, China, Brazil, Germany and a string of Asian countries Central banks said they are preparing measures to defend their economies against capital inflows due to the weak dollar that the Fed has set us on a path toward.
Look for these reprisals soon, which of course will have an impact on the dollar/commodities/equities/etc.
The Fed's buying is targeting 7-10 year treasuries, thus my stock idea presented today and what I've shown in treasuries the last few days.
This is a screen I use t avoid false crossovers or whipsaws. Note in red all 3 conditions were not fulfilled, giving a false signal. The recent white boxes show all 3 conditions met. We added this trade to our portfolio today. In addition, the 3x leveraged bear position on 20 year treasuries has successfully tested support and is in a base that is about a point from breaking out.
Regarding the late day rally in financials...
Fitch today put the entirety of the US mortgage servicing industry on a negative outlook over the foreclosure problems. The problems in the financial sector are just the tip of the iceberg, facts are still coming out, action is coming and I'd guess it will be profound, along the lines of the second shoe dropping in financials. So today's late day rally that was witnessed in the S&P and DOW, but not the NASDAQ, seems to be due to the Fed allowing “healthy banks” to increase their dividends which in comparison to the above, truly pales in comparison to what is coming in financials.
Note the NASDAQ did not participate.
SPY
XLF ETF (Financials)
Regarding what 3C is seeing...
I haven't been posting the number of funds that are holding or accumulating shorts, but so you understand why there are negative divergences, it's these actions by smart money that 3C is portraying by way of negative divergences. So today Alberts Edwards said they aren't covering their shorts believing “recession looms” which they believe will trigger a 60% decline in equity prices.
Furthermore they go on to say, “Bull/bear indicators suggest that the equity rally is now exhausted and crying out for a major correction “
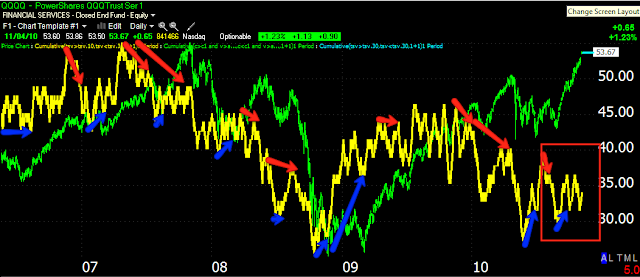
On the daily charts, the most important, you can see there's been no confirmation, but there have been and remain negative divergences. If you are wondering what 3C's track record is, look at the QQQQ chart, the blue arrows indicate divergences, both negative and positive, the point is, they are all successful.
QQQQ daily chart-with blue arrows showing effective past divergences.

SPY daily
In fact, going back to late 2006, here are the positive and negative divergences in the 3C daily chart that were all accurate, whether they be smaller intermediate/sub-intermediate moves or bigger primary moves, each one of these has been correct and we are now in a negative divergence, this one if it were to fail, would be one of the first.
red for negative-watch the price move right after the divergence/blue positive.
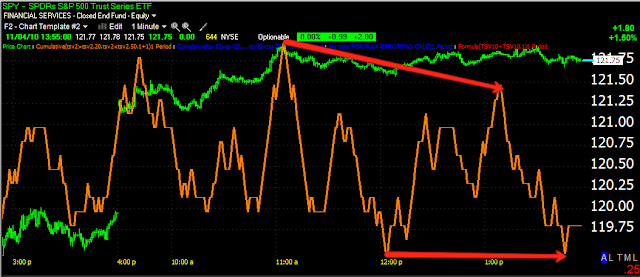
Here are the 15 min 3C charts in negative divergences as of the close today:
QQQQ
SPY-note where 3C was and where price was at the start of the divergence and where they both are now.
This is from an email I received from a member today:
"Hi Brandt,
I wanted to let you know one of my close friends is a hedge fund
manager, his fund has about $8 billion in total assets, he's been
accumulating shorts on various issues and has been getting killed on
”
I didn't get into specifics beyond this note, but a hedge fund manager with $8 billion under management isn't accumulating shorts for no good reason. This is precisely what 3C shows us, what “smart money is doing in a price trend”.
And if your thinking, “maybe the manager's not that smart”, I'd caution you that these people have reasons/information and even when the market is moving against them-(the Turtle traders are a prime example), they stick to their convictions because they have good reason to. Daily fluctuations or a two month rally are not cause for them to throw in the towel as most have a broader perspective on the markets and are going after big returns-at least in the Hedge fund space (as compared to mutual funds).
The VIX is still showing a massive positive divergence. The last positive divergence led to a pretty nasty sell-off, a divergence of this size, I would have to assume will eventually see a sell-off commensurate with the size of the divergence.
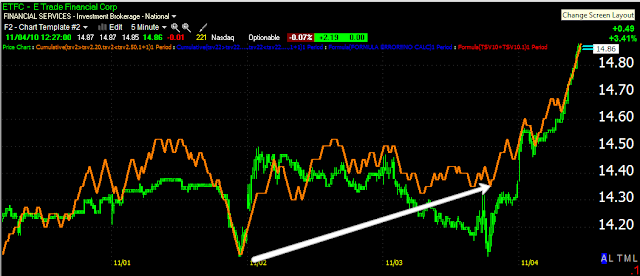
ETFC trade that triggered today made a decent gain since it was posted.
The BIOF trade looks pretty good.
Note the recent divergences . the most recent led to the recent move up and now BIOF is in a leading positive divergence.
As for the stats today, they were very strong, I'm not talking about price, but the breadth of participation and the Price/Volume relationships. However, often these very strong stats are a sign of a one day overbought condition so tomorrow we'll see if we get follow through on today's move. As for today, I believe it was the start of the Fed effect and we shall see if it reverses course as is typical.
Otherwise, continue to check the trades posted on the list, many are doing well and the trades featured on the main site like today's TMV. Unless you are trading the market averages alone, there's no reason you can't make good money in these trades.


