Thursday, July 2, 2015

Closing Indications

I still think the most probable outcome is for a bounce early next week, perhaps even a quite spectacular one, but the charts are hesitant and why shouldn't they be? I'm not sure how Wall St. can have better inside information than anyone else as to how Greeks vote on Sunday.

Thus I think probabilities favor an early week bounce, but the intraday charts today are not providing those signals that jump off the chart and can't be ignored, that means the difference between probabilities and a high probability / low risk trade is pretty definitive and as such, I see no reason to add any more long risk than the current IWM calls in place.

I see very little reason to close core shorts unless you are a very active trader, my view point is I want my core positions to be aligned with the path of least resistance and highest probabilities, if anything is up in the air, price will come down on the side of highest probabilities on a big picture basis.

It may even be that early next week we get the signals that give us opportunities to open new positions long or short. The current base for a bounce could be in place to bounce on a favorable outcome and offer enough time to get new shorts in place on an unfavorable outcome, thus patience is key in my view unless you rather just make a bet, but I think there are some sites taking actual bets with high payouts, I don't think the market is the best place to make a bet.

We'll see what happens Sunday night as Greek referendum results start coming in and futures for the new week open, until then, I wish you all a very happy and safe...


USO Breaks $19-THIS IS HOW PREDICTABLE TECHNICAL TRADERS ARE

Why do you think the $19 level was a possible game changer for USO as far as I was concerned? It's because Technical traders are extremely predictable which is why head fake moves even exist in the first place. Before Technical analysis became popular once the internet allowed the creation of cheap online brokers, it worked as advertised. Since things have changed and it's because Technical traders have NOT. I have written about this in some detail and I think it's a must read and understand to trade the modern markets so here are the links once again...

Understanding the Head-Fake Move... How Technical Analysis Went From an Asset to a Trap

&

Understanding the Head-Fake Move... Motivation

This is the best real world example you'll see today...
 USO daily is back in the range, but still not free of the range bound trade in the area.

This is how predictable technical traders are, "Where should I put my stop? I see support at $19". Why do you think EVERY retail establishment NEVER uses whole numbers, for instance, $18.99 rather than $19? It's because our minds are attracted to whole numbers and $19 sounds like a lot more than $18.99 subconsciously.

Here's the attraction, that spike in volume are stops at $19 being hit as price breaks to $18.99, One CENT! Even if you want a stop in the area, choose $18.88, it's too lucrative for market makers/specialists and others to hit those stops and they are all loaded up at the same area, $19.

 So far short term charts are in line with the downside. This could be the start of the change in character I was hoping to see below $19.

Oil futures are in line as well.


The Week Ahead

It may be a little early for the week ahead post, but there's only so many outcomes and so far today it has looked (including the rest of this week), like there's a bounce set up and in place and a bounce early in to next week looks like the most probable outcome, however for the first time in a while with a divergence of this size in terms of days, it also looks like if things go wrong over the weekend, which is obviously the biggest market catalyst, that there's not a whole lot committed to a further bounce and the cycle could be run over without too much damage. Usually only intraday charts are run over. I'm not trying to hedge my bets here or analysis, I'm just telling you what I see.  For instance, HYG has been employed to help out and a short term additional bounce from Monday's lows, looks probable, but not to the degree that we have seen in the past, thus limiting downside risk by not having much invested.

 HYG 3 min looks very impressive and looks like  the highest probability early next week is a bounce, perhaps a pretty impressive one.

I'm not sure how you get around the wild card of Greek elections, but that's the 3 min chart and the thing to remember is it's a 3 min chart, not a huge investment as the 5 min chart sees no accumulation.

 5 min HYG chart/trend.
Leading Indicators continue to look like a strong bounce is the most probable short term outcome early in the week, however the SPX:RUT Inversion is either telling us that one may not participate, or the bounce will be short lived no matter how impressive it may look.

As  for the charts, this is perhaps the best perspective of short term /early next week and primary trend, the primary downtrend is by far the highest probability and any bounce should end with a new low eventually being made below last October's low.
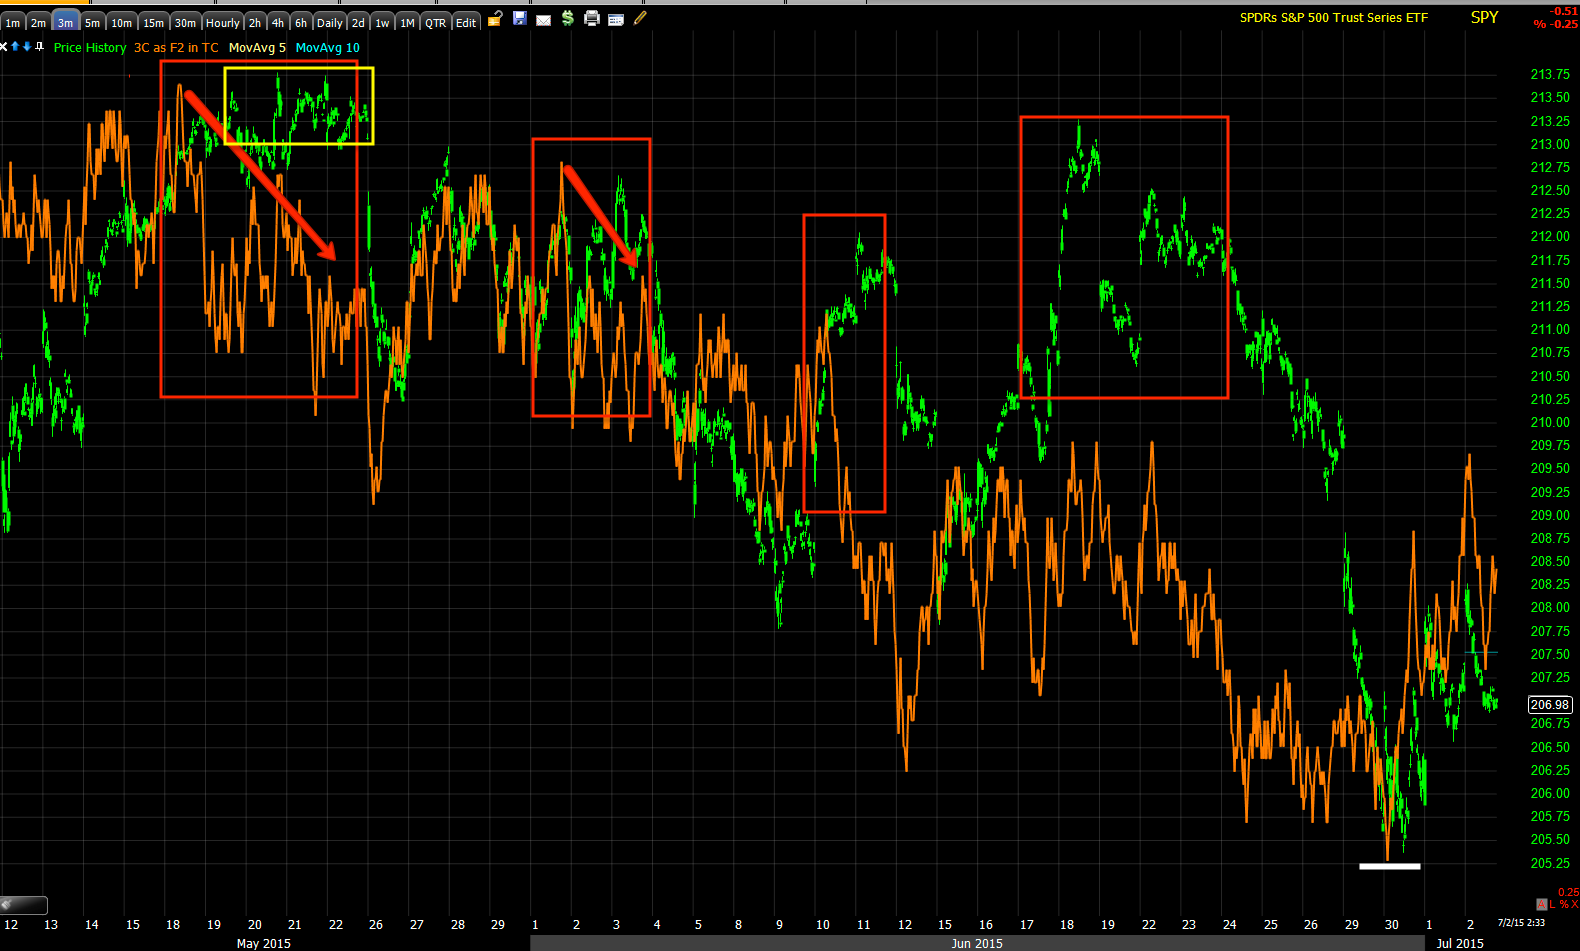
 The SPY's strongest chart that is solid is the 3 min, again short term indications, but looks good.

Put that same timeframe in perspective and you can see any bounce attempt since the May head fake has eventually been shot down and the SPY has made a new lower low, I don't expect any different next week.

 The primary trend daily chart shows just how bad things have been throughout 2015 and that's why we are seeing the downside we had not seen before this, this chart would need a half a year to repair itself, it's not going to happen.

The QQQ bounce chart goes out to 10 mins, but again...

In perspective, every bounce in the Q's has been met by strong distribution and lower lows since the May head fake. I don't expect any different, thus the bounce becomes useful for the very reasons cited when closing Puts earlier in the week.

 The daily chart needs no interpretation.

The intraday IWM is in line now so maybe I may take some short term position action before the close if things improve, but I'm not letting go of any core short positions.

The 5 min chart and a sort of "W" base are the strongest the IWM has.

In perspective, there was a decent accumulation area that ran the R2K higher for a while, that ended wit strong distribution in to the red area and we have a new leading negative low, so once again, things must be kept in perspective. A short term, even incredibly powerful bounce has the same downside fate.

And the daily IWM needs to explanation. This is the highest probability primary (bear market) trend. Thus I wouldn't bet against charts like this for very long.

I still put probabilities on a bounce early next week and if it's going to add to this week's: SPX +.81% ; Dow + .68% ;  Russell 2000 +0.11% and NDX +1.09% I'd expect it to do so with some gusto. However one way or another, whether the market responds badly to the vote Sunday or the bounce runs its course, I believe we'll be headed this way in very short order...
 October lows and a break below.

This may seem like a stretch, but remember that bear markets fall about 2.5 to 4 times faster than bull markets rise because fear is stronger than greed.

Many may not even be aware of it yet, but take a closer look...
The SPX is already making lower highs and lower lows on a primary trend basis.

Once this 200-day sma is broken...
Things take on a whole new perception and urgency.

Just like the October lows made the initial break, back in 2007 we had an initial break, then a slowly creeping set of primary trend lower highs and lows that few probably noticed, then things fell apart quickly once fear really grabbed hold.

I'll be watching the rest of the day for any additional color for early week movement, I'd still tip my hat to a bounce, but I can't foretell how events in Greece play out, we are in uncharted waters as they are the first developed country ever to default to the IMF now in the ranks of Sudan and Zimbabwe. As far as how that ends, well I think the case has been made for sometime as you can see by the 3C charts that show a trend view-every bounce is sold.


NOT Taking Any Additional Action FOR NOW

In looking at the charts below, I have to remind you this is not a situation in which we weigh the pros against the cons and make a decision and take a position, that's an attitude that reflects the notion that there are only long or short positions, there are also stand aside positions and that's what I will do for the moment until/unless I get better data.

Remember a high probability / low risk trade is not about probabilities alone, it's about high probabilities, charts that jump off the screen and can't be ignored, barring that you are just taking what you think are the best odds rather than excellent odds.

Along those lines, so far this is what we have....
 TICK intraday with some slight improvement.

Our custom TICK indicator is showing improvement as well. As I said, "probabilities", not necessarily the same thing as high probability/low risk trades.

 The 1 min intraday SPY looks the best, going positive.

There's migration to the 2 min chart...

The 3 min chart's trend is leading, intraday it's in line, not positive as of now.

This is probably the best case argument for a speculative call position/long very short term.

The QQQ 1 min isn't nearly as developed as the SPY.

The 2 min QQQ is in line.

While the 5 min IWM chart seems to show us a "W" pattern base that should move higher, the problem is timing.

The intraday chart hasn't gone positive which means it can continue moving lower even if it is a base, meaning our entry wouldn't have a high probability timing signal as you can se above.

This to me is the scales of evidence, weighing one side against another and making a decision, that's the kind of analysis I reject. I want the charts to scream, to be so powerful and convincing that they can't be ignored. I'd say probabilities favor an upside move from here, we have felt that way since Monday's deep plunge, however I have about as much long risk as I can justify at the moment.

This may change as the 2 pm hour is upon us and the max-pain op-ex pins are removed, so stay tuned.

UVXY Follow Up/Charts

I don't like leaving anything on the table, but I like it even less to watch a green position go red so I don't see the harm in closing the UVXY long and taking the gains beyond maybe a little bit of a bruised ego.

As far as near term charts, you'll see why I took the gains, but intermediate and longer, you can see why a longer term perspective trader probably wouldn't have a problem holding.

The P/L looks like this:


At a cost basis of $37.07 and a fill of $43.42, the gain came out to almost +17%.

 intraday the in line status has gone negative.

The 3 min chart shows the huge accumulation area and a recent pullback signal, there have been no positive divergences in the green area which is in line, to suggest the larger uptrend represented by the large assume;action area is ready to start back up immediately, but it is still a high probability, although more downside is likely for that divergence/reversal back up to develop.

The 10 min UVXY chart is positive and in line, but not telling us anything about very near term action, this is telling us that eventually UVXY will return to the upside, the market the downside, but there's no detail here for near term price action.

Thus, I took the actions I took and feel justified as far as objective evidence goes.

Closing UVXY Long Position

This is just for now, short term based on what I'm seeing. I haven't made a decision on the VXX puts, just protecting some gains.

Considering VXX July 17th $20 Puts

I haven't made the decision yet, but if I do, it will be very soon. I'd probably consider this a VERY speculative trade based on fundamental news events, but based on charts, not so much.

Op-Ex 2PM Update

Usually an op-ex pin, pins around a certain level, today has been more of a moving target, but if history has been a guide, then around 2 pm  most contracts are settled and the op-ex max-pain pin is released.

There are subtle signs the market is making that right hand turn, but all in all it's giving off a very negative tone, I'm wondering if it's not for a big surprise.

As for a wider "W" base, the IWM right now is in the exact position of such a base, although it would have to show 3C accumulation/confirmation of the head fake low that breaks support of the first "W" support pivot and soon.

 IWM possible larger "W" base with a head fake/stop run below the first "W" support pivot which is the common "W" pattern.

The price-based implied target of such a base would be in the $128 area which is interesting considering the weekend.
 The SPY intraday with ROC applied to price to better see the sideways bias shows the earlier down and the more recent turn to the side that's easier to see with the help of price ROC.

The Q's are showing the same thing as we near the 2 p.m. hour.

The NYSE TICK has been trending in this channel all day, so a break above the channel would be a significant early warning of an upside move in to the 2 p.m. hour.

HYG in Green is outperforming the SPY in red, which is unusual as HY Credit would be the first to sell off unless as we have seen so many times, it's being used as a lever for market support.

I'm reinstalling my minute data for my normal 3C indicator, there was a corruption of about 30 minutes missing so it's a lengthy process to reinstall it all, but it should be done in about 10 mins.

Until then, the intraday Index futures have gone positive and right on cue before the 2 pm hour, interestingly though today's price action doesn't feel like a normal op-ex max pain pin, however I think there's more to the story than meets the eye with early price action only.

So far the Index futures look like this intraday.
 ES is positive

NQ is positive

TF for the first time has put in the first divergence, otherwise in line over the last 30+ hours, turning positive. That's 3 assets confirming and the 4th...

VIX futures should confirm with a negative and there it is.

I'll add additional 3C charts as soon as the minute data has reinstalled, but it looks like this could be a bigger base for a bigger bounce for whatever reason that we are not privy to. Once I see the other 3C charts for the IWM, I'll decide whether I'll take that short term call position in the IWM up to full size. Keep an eye on the NYSE TICK's trend and a break of it as early warning.

Quick USO Update

In the A.M. Update this morning I noted what looked to be a USO/Oil bounce, that looks to be ending at least intraday.

 Oil futures from this morning suggesting a bounce and now starting to fail.


In addition the USO intraday charts are starting to fail as well, 1 min

USO 2 min

That doesn't mean the issue of recent signal improvement is settled as either transitional or noise, a break below the $19 support level (exact) would go a long way toward settling the near term and intermediate term USO projections, leading to the longer term trade opportunity.

Market Update

So far there hasn't been much to do but watch and wait, the intraday charts are ugly, but the slightly longer charts are not giving ground which tells me there should be an upside transition at some point soon. Well it's VERY early, but it feels like that transition is starting.

 SPY 1 min looks like it is very early in to the start of a leading positive divergence and it looks like it will transition from down to lateral which is the first step in an upside reversal.

 As mentioned, no damage to 2, 3 min charts and the SPY 3 min is still leading positive in a big way (at least for the near term).

ES intraday futures are showing improvement as well.

As are the completely in line Tf/Russell 200 futures with the first divergence of the entire period since early yesterday morning. If this turns out to be something, than I may fill out that IWM call position to full size.

And the custom TICK shows intraday breadth changing tone to more positive as you can start to see the SPY starting to make the turn to the right and toward a flat trend, again the first step in an upside reversal.