Friday, July 20, 2012

UNG Breaking out?

For long time members, you know we have been following UNG with interest for quite a while as fist a change of character was noticed, then a base and lading positive divergences and now we are in the area of a stage 2 mark up. UNG is one of the only long term long positions I like.

Take a look at UNG today, this is why I have sworn to hold on to UNG through pullbacks, crazy trade, whatever may come, I believe this stock is going to hit stage 2 mark up and see a nice up trend develop.

The straight equity long in UNG in the equities model portfolio is already up 24%.

 Today UNG is above the area in which I would consider a major milestone, we are not seeing the heavy breakout volume, but that will come from retail.

 We didn't see heavy volume on the break above on the 60 min chart, but there was an increase, smart money is not chasing UNG higher, the volume spike may be helped along by smart money, but it is not smart money. That volume spike is what we need to see to put UNG on everyone's radar as they run volume surge scans thinking those surges are smart money buying, smart money as we can see below was in a long time ago.

 The 5 min chart shows accumulation on the 17th in a flat area, that is likely smart money. Overall the 5 min chart doesn't look that bad, this could be the breakout move we have been looking for.


 The 15 min chart after the first failed breakout attempt as it was not ready, put in a strong accumulation move in June/July on an important timefrmae, that's where the bulk of the last round of accumulation was.

 Here the 60 min chart shows accumulation and UNG being sent to lower prices to be accumulated more.

It's the overall 60 min chart that shows how active smart money has been and where in UNG, they don't chase stocks higher, they buy on price weakness. We have a leading 60 min positive divergence, UNG should be pretty close to entering stage 2 mark up, this is where UNG will have its best chance at a trending move. I intend to continue to hold this position open.

Some Other Assets

The closer we get to the close with no rally, the more it looks like the intraday positive divergences are going to carry over to Monday's trade as the market is pinned today for op-ex.

The divergences are still short term meaning a short term move or noise, but it can be used tactically, like for a better entry in VXX / UVXY calls. The longer more important timeframes still point toward the next trend being a pullback move.


 The 15 min Euro is negative or rather leading negative, but...

 short term 2 min intraday has built a positive divergence all day, this still could be used just as support to hold the averages in place for a pin, but seeing HY credit up kind of tells me a move up early Monday is more likely.

 The $USD 15 min is still positive, which is a market negative and leading positive, but...

 The same 3 min intraday chart is leading negative, pointing to a short term move down, which is short term market supportive.

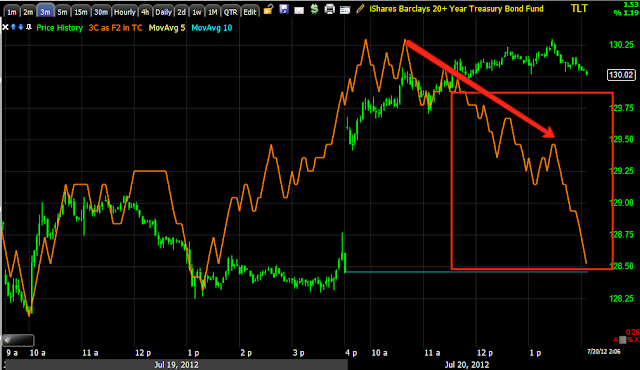
 The flight to safety trade is seeing short term distribution intraday on the 3 min,

While the more important 5 min is leading positive.

So all these assets are showing the same thing, near term strength (looks like Monday), followed by a stronger pullback. Monday would more or less amount to a noise day although as mentioned, it can be used for tactical entries.

This looks like the highest probabilities right now.

Market Update

If we don't get a strong move in to the close, which doesn't seem highly likely on an op ex day, then I'd think the divegences built up today were for 1 of 2 reasons; as we have seen before a positive divergence can be used as a consolidation, it's sort of support in a market that otherwise wants to head lower and with the 5/15 min charts negative, the market generally wants to head lower, so it could be used as support to keep the market in a range that is most advantageous to an options expiration pin (causing the most amount of pain in worthless, expired options), or the positive divergences could carry over to Monday, we had a similar situation last Friday when some divergences from Friday carried over to trade on Monday.

Here's what some of the averages look like...
 DIA 1 min continued positive today

 IWM 2 min continued positive

 IWM 15 min, the larger trend is to the downside in near term trade over the next week.

 QQQ 3 min cont. positive today

 QQQ 5 min larger negative trend over the next week

 SPY 1 min positive

5 min positive.

It seems to me that a 5 min positive is too much to just hold an average in place for an options expiration pin, it seems excessive.

As for some of the risk assets...

 Commodities are diverging positively from the SPX in a pretty big way

 HY Credit is also diverging to the upside, this makes me think we are going to see the short term upside whether we see it at the close or Monday.

 HY Corp. Credit is just starting to move a bit near the close away from the SPX.

 TECH ad Financials are close to in line with the SPX, but energy is leading, just like commods.


Sector rotation today, Financials weak, Utilities strong, also Staples in the flight to safety are strong. In the risk group, Basic Materials are building as well as energy. Industrials, Tech and Discretionary are falling off.

I'd be apt to say if there's not a strong closing move up, we see some of this positive divergence take hold Monday.

Follow Up UVXY/VXX

Just to be clear, I'm just looking to trade around the UVXY calls, I still hold some August $9 calls (Fat finger trade-meant to get a $7 strike).

Also I still like VXX and UVXY for the near term trend (market pullback).

 VXX which often gives better signals on a 1 min chart with an intraday leading negative divergence confirms all the other charts we have seen.

 Beyond that short timeframe though, charts like the 3 min have a great leading positive trend

 Or the 5 min

Or even the 15 min, so I'm just looking to take some quick profits and look for a better entry in that particular position.

Closing August UVXY

Considering I'm expecting a short term move higher, I'm going to close the UVXY Aug $6 calls at a profit and look for a better entry.


Market Update-Intraday-Closing move still coming

Now we are getting signals on ES as well...
At the green arrow ES is in confirmation with 3C making lower lows until ES makes the low of the day, 3C is positively divergent at the low and after that has moved to a stronger leading positive divergence.

As for confirmation among several asset classes...

 Momentum in the SPX has died off to the downside as ROC shows here. As I often remind you, reversals are rarely an event, they tend to be more of a process.

 The SPY 1 min continue building a stronger leading positive divergence in to a flat trading range where we often see accumulation and distribution because of stable prices.

 The SPY 2 min chart has added considerably to the leading positive divergence, suggesting there's been more or heavier intraday accumulation, I would suspect this has something to do with moving the market to the intended op. ex. pin, which obviously seems to be higher, but it could also be used to shake out shorts, especially if the downtrend in the short term trend is to continue on Monday.

 The flight to safety trade, Treasuries are seeing distribution in to strength in the same timeframes as the averages are seeing positive divergences/accumulation, the 3 min chart. Treasuries and the market have an inverse relationship so this is a form of confirmation is a totally different asset class.

 We would expect some support from the Euro and here we have a 2 min leading positive divergence in the Euro.

At the same time, if stock prices move higher, we'd expect weakness in the $USD and here on the 5 min chart we see a negative leading divergence in the $USD intraday. Add all those up with the averages themselves and there's pretty good confirmation for a short term move higher.

Chart Request -CMG

CMG came out with earnings, as you know once in a while we'll catch an earnings leak in a stock, 3C can't tell us what earnings will be, but will suggest how the stock will react and when something just doesn't look right, we suspect an earnings leak.

CMG obviously didn't impress as they are down 22% right now after reporting, the chart request I received was whether or not there was anything that didn't look right in CMG, the answer is yes.

 The daily chart with the 22% drop today

The 3 min chart seems to show a pretty strong round of accumulation, this would normally see the stock move quite  bit higher, but shortly after that there was nothing but distribution in to higher prices, as if something was found out after that position was accumulated at the lows.

 The 5 min chart shows the same thing, a leading positive divergence or accumulation at the lows and then a very strong leading negative divergence in to higher prices as if those accumulated shares were being dumped aggressively in to higher prices and earnings. All of these charts have been rolled back to yesterday's 4 p.m. close except the last one so you can see what 3C looked like before earnings.


 The 30 min chart also shows a leading negative divergence in to higher prices, this is a pretty long timeframe to see action like that if everything was normal and there wasn't inside information floating around.

The current 15 min chart showing the increasingly negative divergence in to yesterday's close, today at the lows there are obviously some knife catchers as we see a positive divergence, perhaps we get a dead cat bounce from here, it's not my kind of trade, at least with what we see as of now.

Market Update Follow Up

The positive divergences are intraday, they're mostly confined to 1-3 min charts with 5 min charts remaining persistently negative, 3C translation would suggest an intraday move up, but that's about it, our pullback as the next trend (even though it is likely to be a short term trend) is still the highest probability in the days ahead.

 DIA 1 min positive intraday divergence.

 DIA 5 min still leading negative, the 5 min chart is much more important than the 1, 2 or even 3 minute charts. The depth of the leading negative divergence on the 5 min chart is also quite impressive, I'm not even getting in to the 15 min charts in which several averages are negative there too.

 IWM 2 min leading positive intraday divergence

 IWM 3 min leading positive intraday divergence-note the migration through the fastest timeframes to the more important longer timeframes.

 However, along those same lines, note that the 5 min charts are not swayed at all, the intraday divergence may look pretty good, but it's not effecting the more important 5 min chart which is still very much in a leading negative divergence.

 QQQ 1 min leading positive divergence

 The QQ divergence made it to the 3 min chart, obviously not quite as strong here as it is on the 1 min chart.

 The QQQ 5 min chart remains in a leading negative divergence. For newer members, this just suggests a high probability intraday move up, followed by the resumption of a trend lower.

 SPY 1 min leading positive divergence

 2 min leading positive divergence... The 3 and 5 min are also positive, although less positive as they enter longer term charts.


The 15 min chart is like rock to the 5 min chart's scissors, this is leading negative on a very important timeframe, we may see some intraday strength that may even be impressive (gap fill perhaps), bt don't let it fool you, remember what the longer term charts look like. That being said, the strength can be used for tactical entries, for instance a move up in the market may give you a better entry in to a position like FAZ long.