Tuesday, May 21, 2013

Futures Tonight

It's actually a relatively quiet period in futures. Gold and Silver futures both look like they are set to continue to base which is great as it will provide for a stable trade, how soon depends on how fast they are accumulated.

The one future that does stand out is the yen, with the BOJ policy meeting coming out this week (tomorrow I believe) we can already see heavier than normal accumulation in the yen as well as distribution in all of the pairs, USD/JPY, EUR/JPY and AUD/JPY.

If 3C calls this like it called the last move in the yen, then the yen should rocket higher as it has already carved out the base, put in the head fake move and accumulation.

As far as the correlation with the market goes as of now, it should have a negative effect on the market, I suppose it all is up to how much the Yen actually moves.

I'll keep an eye on that as well as the correlation.

Tomorrow we have Bernankadido at 10 a.m. and of course the last F_O_M_C minutes at 2 p.m.

Tomorrow I'd expect lots of volatility, it may be excellent for smaller intraday options trades like the AAPL put that was up nearly 15% today at one point, so it may be worth taking some of those profits with minimal risk.

We'll see what the market offers and then take as much as we can.

Daily Wrap

First we have the BOJ Policy meeting going on today and tomorrow, so we have the results of that coming which decimated the JGB futures sending them limit down numerous days, what impact it has is unknown, what they do is unknown, but there's a feeling out there that they went too big, they lost control.

Of course after 4 F_E_D speakers this week so far with some highly unusual comments, we have the fifth tomorrow morning at 10 a.m., The Bernakanator himself. Is it just me or does it seem like there are a lot of F_e_D speakers this week pre-empting tomorrow's 2 p.m. release of the minutes from the last F_O_M_C meeting which was strange any way, "We could buy more, we could buy less", even though they have been slow boiling the frog since announcing QE3 to condition the market that less will be coming sooner than later.

This bit is boilerplate, whenever there's anything F_E_D related like a release or policy statement I always warn (because it's always there), "Beware the knee jerk effect". We see it so often that it's pretty much a mainstay, that could be useful immediately or it could be something to keep in mind, but if you go back to a F_O_M_C meeting from 3 years ago in the archives, you will see I warn the EXACT same thing EVERY TIME.

I saw something interesting today so I thought I'd bring it to you. You've heard of "Doctor Copper" before? In essence the direction copper takes is a leading indicator for the economy/stock market.

 This is Copper in green vs the SPX.

If you are still going on about Doctor Copper, then you probably took a few years off from trading, don't get me wrong, I think it is still useful, especially on the macro economic side, but Copper has been replaced by, "Dr. Wood". It seems wood futures are a much better sign post of economic and stock market activity.

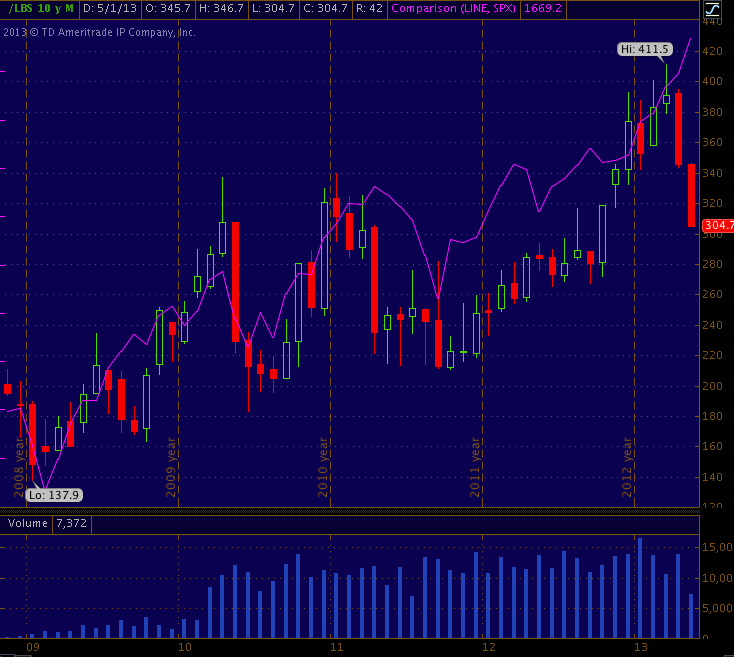
Along those lines, here's Lumber futures vs the SPX in purple on a daily chart since 2009.
 Remarkably, Lumber follows the SPX pretty well, in 2010 it actually was a leading indicator and warned of the downturn before the SPX hit it.

Now take a look at the daily chart of the same two assets...

 Whoa! What happened here to lumber? That's pretty ugly and just for kicks I took a look with 3C, unfortunately I can't get enough history on TOS to properly scale the two, but the divergence is clear.

3C was in quite a negative divergence at the top of Lumber's run and is now leading it lower.

Now remember last week I said, "We're going to have to pay more attention to Macro-Economic releases"? That's because any feeling in the market that the F_E_D is "ify" on QE or cannot be counted on to backstop the market, the market will front run like it did in QE1 and QE2 (market declined well before either ended), but in this case it "could" be worse because the market doesn't have calendar dates to reassure, things can change any moment and with index multiples like we have, Macro-data I believe will play a much larger role in reducing risk and bringing prices to a less "Disconnected" state with the real economy.

Keeping that in mind, take a look at Dr. Lumber vs the US Macro Economic Data trend.

Hmm... Pretty interesting in my opinion.

As far as today goes, the market struggled, what else do you call a +0.05% close in the R2K?

Again, as as has been seen for the last two weeks very acutely if you pay attention, risk is sold, safety is bought. I didn't see anything that really ring my bell today, other than that increasing trend. Even if you don't have 3C or any indicators at all, it's plain as day on a price chart when comparing a risk and non-risk asset. This may be the first time in over a decade I've seen real support caused by real demand and not just some manipulation of technical tradewrs' expectations.

Here are a few examples...
 Yields weren't playing along as Treasuries weren't playing along. This is a leading indicator because if you have a risk on sentiment, then money is coming out of treasuries and going in to stocks, why sit in treasuries that barely move when you can be in stocks that have much better beta? And when treasuries fall, yields rise, that's why the two usually move together and when they don't, equities tend to gravitate toward reversion to the mean of yields.

If you saw (and you probably have), the longer term disconnect between the two, you might raise an eyebrow. We'll see more when we get to TLT.

However it wasn't just a bid for the safety of treasuries at work today, most of the entire risk asset class was going the opposite direction and considering the SPX only closed up 0.18%, these 12 ES points suggest the risk assets were really being sold, not just trailing behind.
CONTEXT for ES (SPX futures).

 The VIX Futures saw some early manipulation, it would seem that way, I'll show you why next, but they bounced right back as traders bid up VIX futures (protection), the 1 p.m. climb in VXX along side the market is a type of oxy-moron, risk is on or risk is off, the only way you can have both is if one is being manipulated or retail is going one way while institutional is going another.

Note the SPY arbitrage goes from supportive to less so and negative around 1 p.m.

Here's what I mean by, "You don't need indicators to see support" as the VIX futures would be moving lower on a risk on move, they have support because they are bid.

It wasn't so long ago that the VIX was making 6 year, then 6.5 year , then 7 year new lows as the market went higher, you probably recall; that has stopped.

 TLT-Treasuries were bid all day as well except for some early shenanigans off the open, the last hour or so is the normal correlation we are use to seeing, the market heads down in to the close (and what happened to the EOD ramp on a Tuesday that was going for 19 of 19?) and Treasuries rise as they are bid as a safe haven, the only problem is they were bid all day.

You may recall toward the close it looked like TLT was going to pullback with 1,2 and 3 min intraday negative divergences that were strong, as soon as it lost a little ground positive divergences jumped right in and again, any weakness in protective assets was bought, while strength in risk assets was sold.

Example...

The IWM 5 min chart-by the way, for those using 3C or curious, this is the most typical development of a divergence, first a relative divergence to the far left, than a deepening divergence as it gets stronger (in this case the negative divergence) and then to the strongest divergence, a leading divergence which is seen very clearly in the IWM today  -actually before today, today was just VERY sharp. This happens on 1 min intraday charts, 5 min, 60 min and daily or 5 day charts, it's just the process.

The point is as TLT was seeing accumulation in to slight strength, IWM was seeing distribution in to slight strength, even without 3C you can see that by the IWM failing to make a higher high.


TLT vs. the SPX (green) saw TLT purposefully knocked down with divergences on the 16th, I've already showed you the evidence as the SPX failed to breakout of its triangle on Thursday. Note how TLT moves lower allowing the SPX to breakout of the next day's triangle, this is the arbitrage effect that is used in short term manipulation in HYG, VXX and TLT. However today TLT showed some nice resiliency.

 The VIX itself vs the SPY in red today saw some early weakness helping the SPY, then it was up, but even before the SPY started heading down off the intraday highs.

In fact the VIX closed up today, it normally closes down if the market is green-even light green.

However what is most interesting about the VIX chart is the continuing pinch in the Bollinger Bands suggesting a highly directional breakout in the VIX, I doubt it's to the downside with all the VXX accumulation and if to the upside, that's fear and that send the market lower.

The Yen saw a bit of the correlation in the afternoon that it has been showing lately with the SPX, that is why I think the BOJ policy decision and statement will be important for the market, it may not be 1.0 correlation, but it's a lot better than the Euro or AUD which use to be near perfect.

Note the Yen gains ground in the afternoon and the market loses it, the opposite occurred in the a.m.

Since 3C on the Yen was right on about the BOJ policy decision with a nearly 8 hour divergence before the announcement that was dead on, I'll be watching the futures for the yen and carry pairs closely.

This may not look like much of an inverse correlation between the $U?SD and the SPX, but the SPX has totally ignored the USD for months, only once the USD broke out above its base did we start seeing the market paying attention and showing some correlation, so that's something else to watch as the $USD looks ready to make a significant move higher. Remember, QE sent the $U?SD lower, if QE is withdrawn, slowed or unsure, the $USD stands to gain. I've already said numerous times that I believe the $USD base and breakout are directly tied to QE, in fact the base started right at September, the same time I thought the F_E_D was getting "ify" on QE, I'm sure smart money has better connections than I so the start date of the base and the F_E_D's change in language and posture correlate very well.

I'll be putting up the futures as well as a few other assets that I think might be decent trade set ups.

I like the lateral motion in Silver and Gold, it's a process that they need to undergo, but the lateral trade is part of that process.

I also really like USO short, I'll be looking for any opportunities that open up (USO strength) to look for trades there.


Post Close

Well not only did we not get the afternoon ramp the market has become notorious for, but the R2K barely closed in the green (which is significant because the Russell 2000 is usually the leader of risk on moves). The R2K closed green by 0.05%, a hair. The Q's weren't much better and even the SPX was 0.16%.

TLT, which had an intraday negative from 1 to 3 minutes would probably be the first time that we didn't see a pullback-correction of some significance. Typically if the 1 min is negative we have a 50/50 chance of a pullback (through price) or a consolidation (through time), but as soon as the 2 min chart joins the 1 min chart in the same divergence, it almost guarantees a pullback, we also had the 3 min chart (all intraday timeframes) and all with handsome negative divergences, they weren't ambiguous.

So TLT was not only not used as an arbitrage asset to hold up or ramp the market in to the close (which may have been the intention with the 3 intraday negative divergences), the very slight pullback TLT did see this afternoon was accumulated as I showed you and then driven higher.

My guess is that TLT was being set up as an arbitrage play to support the market in to the close and buyers seeking the protection of Treasuries stepped in and overwhelmed the manipulation with real fear, real demand for safety.

TLT's negative divergence this afternoon with a tiny pullback and then accumulated and pushed higher.

This is another example of risk being sold and safety being bought. If you just came home from work and looked at the market, you might notice it here and there, but most people are looking at price only, however when you watch the market all day, everyday, you can see these trends in what is being bought and what is being sold and this has been VERY obvious for weeks now in addition to the damage that was already done-this was a new front that has been consistent.

Although VXX was initially flipped in the a.m. to support the market...
 (VXX=green vs SPY=red) Not only was VXX flipped as you can see it's early move lower supported the SPY, VXX righted itself and headed higher breaking the natural correlation with the SPY as it moved higher as the SPY was as well.

Above you can see the intraday negative divergence on VXX's open that was used to knock it down early, but it wasn't going to be held down and went straight back up-that's pure demand and demand out of fear. We haven't seen any pure demand in risk assets except Friday's triangle breakout, these are amateur observations, the fact the majority of retail misses this is a disgrace.

I'd like to ask them collectively, "If there's demand for the market/SPY, etc, why then is VXX and TLT moving up against their correlations?" You don't even need 3C to see this! 

Why haven't they noticed the support in VXX (VIX Futures) which should be making new lows, forget the huge 30 min 3C leading divergence, you can look at price alone and see for probably the first time in years how Technical Analysis "USE" to work, that's real support caused by real demand, not some Wall St. Parlor trick.

The only asset that could be used on an arbitrage basis to hold up the market in to the close was HYG and it was used, but right near the close, whoever was holding it was quick to get out.
 HYG intraday at the close-distribution...

Multi-day distribution in HYG.

I guess what I find more interesting at this point as I have seen this behavior building stronger over weeks is what happened in to and right after the close in Index Futures.

 ES intraday today with the open in green below and close in red.


NQ right after the close (white trendline).


XOM Charts

I've been able to hold a fairly sizable position (Short) in XOM and ride out the price action without losing more than 7% on the position and less than 1% of portfolio. I purposefully left room to add at better prices as we often do with positions that are phased in to.

Looking at the charts, I'll just post a few different timeframes with no drawings, the charts should be obvious.

 1 min

 10 min

30 min

I like XOM Short Here

In fact, we started a position short equities in XOM, if I have room I'll be adding to it today.

FAZ 3x Short Financials-

This is a current open long position, it is a 3x leveraged short financials ETF.

Take a look at the charts, the longer ones are the bigger, more important signals, the shorter ones are more timing.

 30 min.

5 min

2 min

I'll obviously be holding FAZ long

Simple Charts, Simple Question

I won't comment at all, other than to say it appears TLT's slight pullback was for accumulation, we still have the closing "ramp " period so we'll see.

I'm just going to group these according to Safety and Risk (like being long the SPY) and show different assets and a few different timeframes.

What is this telling you?

Risk...
IWM 15 min

 QQQ 1 min intraday

SPY 1 min intraday

Safety...

TLT 2 min intraday (the 1 min divergence has migrated over to the 2 min chart)

VXX 30 min

Consider the different categories, the different or same timeframes between them, what message are you getting?

SLV and GLD

I have a lot of emails about the two. I am keeping the AGQ (2x long silver) position open, as far as new positions, I think SLV needs to base a bit more, honestly I'd like to see GLD base a bit more, but GLD does have some longer term positives that could support a bounce right up without much base building.

In a case like this, I'm not too interested as I already have coverage in the PM's, but I wouldn't be as nervous about entering either GLD long equity or maybe a 2x leveraged with appropriate risk management allowing some space, say yesterday's lows or a bit below.

The point of this is really to have a position with some leverage, but not so much that any slight draw-down if it continues to build a base, will do any real harm. This position (as long as there's risk management/position sizing), can wait out  GLD a bit better than say calls or something like that. That's why I chose AGQ, I wanted something that could ride a trend, but whether some consolidations.

TLT

AAPL puts are up double digits now, I'd like to hang on to them, but if you took on the position as a trading position, remember a 10-15% gain for an hour or so is not bad at ALL.

As for TLT, this may be what's going on, I suggested maybe they are looking for lower prices to buy in to, it could also be that they want to ramp the market at EOD as TLT down helps the SPY arb.., either way, I suspect TLT will continue to be accumulated so as we see risk like AAPL and the averages sold, we are seeing flight to safety trades like TLT accumulated.

 This is the first sign of accumulation intraday since I posted the last warning, TLT is down a bit.

This is the 3 min  chart so you can see what I was seeing and then...

A lot of strength on the 5 min chart so it's either some short term manipulation for the SPY Arb in to the close or it's some short term manipulation to accumulate TLT at what some might see the last opportunity at cheaper prices.

I'll let you know if it starts developing one way of the other, there are some leveraged Treasury ETFs.

All Index Futures Have Clear negative divergences

As I mentioned earlier in the week, I think last week as well, the market will front run the F_E_D, I think everyone's a bit nervous about the minutes from the last F_O_M_C meeting to be released tomorrow at 2 p.m., Bernie will be the 5th F_E_D speaker this week to try to pre-empt whatever is in the minutes that is so damaging and is creating fear among F_E_D members themselves. I have an idea of what it is, but you know that already.

I believe this is why risk has been under distribution quite clearly.

TLT Update

TLT looks a little strange, the intraday charts from 1-3 min looks like it wants to roll over, but at 5 min and beyond, it's still strong.

I don't know if this is SPY arbitrage, perhaps someone wanting to buy TLT at a lower price or something else, but it's not heavy distribution as the 5 min chart is positive, it's migrated though, through the intraday timeframes.

Remember TLT dropping supports the SPY via Arbitrage

IWM looks like it is getting ready to roll over

You Can Come Any Time You Like, But You Can Never Leave

That's the first thing I thought of as an analogy to the wise, but unheeded words of former F_E_D governor, Kevin Warsh, "Getting in to accommodative policy (QE) is easy, it has always been the exit that is the nightmare".

If yesterday's two pre-emptive F_E_D speakers (pre-empting tomorrow's 2 p.m. minutes) were not strange enough and  VERY interesting, today we have Dudley scared witless of the market's reaction to what Warsh warned about, "Policy Normalization" and hew should be, every time the F_E_D has normalized policy it has sent the market down, they have unprecedented policy accommodation, I'd be having nightmares too.


  • DUDLEY: FED MAY NEED TO RETHINK BALANCE SHEET PATH, COMPOSITION
  • DUDLEY SAYS FISCAL DRAG TO U.S. ECONOMY IS `SIGNIFICANT'
  • DUDLEY: FED MAY AVOID SELLING MBS IN EARLY STAGE OF EXIT
  • DUDLEY: IMPORTANT TO SEE HOW WELL ECONOMY WEATHERS FISCAL DRAG
  • DUDLEY SAYS HE CAN'T BE SURE IF NEXT QE MOVE WILL BE UP OR DOWN

DUDLEY SEES RISK INVESTORS COULD OVER-REACT TO 'NORMALIZATION'

It sounds like the minutes are not going to be helpful to the market.

HYG, VXX, AAPL, QQQ

HYG made upside gains today, that's a positive arbitrage move for the SPY, around the time the market moved up, almost exactly, VXX moved down-also helping the SPY.

Right now HYG is showing worsening negative divergnces, I doubt it has much left in it today and beyond today it's in even worse shape.

VXX is pulling together with accumulation again and should pressure the market.

AAPL obviously helps the Q's, but they are looking like a mighty juicy short target, I'll try to get charts up ASAP, but they are falling apart on the 3C charts fast, this includes the SPY and IWM, although I think relatively speaking the IWM still has a slight edge over the others.

I think puts could be played, ETFs like SPXU (3x short SPY) or QID / SQQQ (2x and 3x short QQQ), but these I'd prefer more on a swing basis.


AAPL Intraday Update

If AAPL can put together another run, I'd look at either adding the the short equity position or if it had enough momentum and kept going more and more negative, may even increase the put position size. That also has some consideration in the overall market as well.

Here's how AAPL's intraday charts are going (remember there was a larger AAPL update last night).

 The 1 min chart is clearly negative, what is important from here is that this negative divergence is strong enough to migrate to the longer timeframes which tells us the divergence or distribution is stronger, the stronger the better.

 2 min

3 min is on board...

5 min is on board so I feel ok with AAPL Puts, but I want puts in to as much momentum on the upside as I can get and just as its about to turn with 3C can help with or ROC on price, the TICK chart, etc.

USO Short / SCO long

I really don't think we are going to get much more out of USO today, maybe a bounce intraday, but not much, I doubt it goes above $34.40 if it can even do that.

I personally like SCO here as a 2x levered short on crude, at least for a swing trade and then maybe set it up again as long as the charts are in line.

I'll be adding a little to the SCO long, we entered last week, it's at less than a 1% loss.

 SCO 2 min

SCO 5 min

SCO 60 min

Opened Small June 22 AAPL $445 Puts

I'd go with a speculative size AAPL Put here

It would be a trading put, I'd still want in the money and June monthly expiration, but I think there's enough momentum and it's going negative.

Market Update

I like the parabolic move this early in the day, they don't end well and they usually can't hold out that long. The migration of the intraday divergences is proceeding, I'm a little concerned the parabolic move could collapse before it migrates to all of the intraday charts, the longer term charts are in good position.

I think keeping an eye on the channel in the intraday $NYSE TICK will be crucial in case the parabolic move collapses before the negative divergence migrates through all the intraday charts.

I was going to post all of the charts, but they look roughly the same, same issues and it's too much time.

I'll use the IWM as an example...
 15 min negative, which is the real work

1 min negative

2 min in line-each average is a bit different, most are negative at 1 and 2 min and waiting on 3 min.

I see the TICK is starting to give way.


AMZN losing Momentum as well

I wanted to add to an AMZN equity short position, I was hoping A?MZN would be able to break above at least the $278-282 area and really >$285, but it seems to be losing its foothold here, I'll probably keep a pretty close eye on it as to whether I want to look at adding to the position at these levels which do not reduce risk as much as I'd like.

 AMZN 1 min trend-leading negative

2 min negative as well... the trend for the 2 min chart also looks similar to the one above.

 AMZN 5 min where it's a bit more important

And the 15 min which is much more important, I'd like to see the current 3C turn down and lock in that divergence.

The 60 min chart shows the area I wanted to see AMZN move at least to, the 60 min chart is breaking down well before we are at that area so I think AMZN needs to be watched closely.