Tuesday, January 17, 2012

Alarming Rise in the Black Swan Indicator

This Sunday I showed you the SKEW Index which is brought to you by the CBOE (same place the VIX comes from). The SKEW is a rather new tool for the CBOE and is meant to reflect the probability of a "Black Swan" event.

The SKEW runs between around 100 (probability of a market crash very small) to 150 with an average of 115. I noticed the rate of change of the SKEW had increased in the post linked above and thus it was worth a post as a possible warning.

Here's what the SKEW looked like Sunday


And here is what it looks like today (1-day change), note that it has increased significantly in one day, near multi-month highs. This is one indicator you may want to keep an eye on, especially with 3C long term charts looking the way they do.


Baltic Dry Index Update

About a week ago I featured a chart of the Baltic Dry Index which track the worldwide price of dry shipping cargo. The Index can be quite volatile, but the trend of the index is telling.

The BDI tells us what demand is for the shipping dry goods (meaning it excludes Oil, Natural Gas, etc) across the world. When prices are low, there is plenty of capacity and it tells us that worldwide economic activity is slowing, demand for imported goods is slowing, exports are slowing, when prices are high it tells us the economy is running at a healthy clip as demand for everything from textiles to I-phones is strong.

The last BDI update skipped the volatility and an underlying downtrend was clear.

Here's today's update (note the BDI is updated every day).


Here's the recent Trend...


And on a 3 year chart, the BDI just hit 1014, levels not seen since 1/27/2009.

Obviously this is macro data and you probably could have guessed it wouldn't be good, but at the levels of early 2009 is quite dramatic, especially when one considers where the stock market is now compared to early 2009.

This is not an I told you so, it's just sad

Just saying, when the Federal Government breaches the debt ceiling as they did last week, the first place they turn to (before Congress) is the US Federal Employee Pension System, yep, they cannibalize Federal workers' retirement funds. I mentioned this would happen last week, just saying...

Bloomberg BusinessWeek


U.S. Suspends Pension-Fund Payments Amid Debt-Limit Debate

Something Smells in Euroland Again

This morning, my first post of the day talked about the large number of short term notes/debt that were by and large, well received despite last week's S&P downgrade. Also the EFSF was downgraded and also placed $1.5 billion euros in short term debt (barely a drop in the bucket compared to the $1 trillion plus leverage of the EFSF that was conceived and went no where). 


This morning I specifically said,  (note highlighted portions)


Overnight as European markets opened, there was some good news; the EFSF after being downgraded successfully auctioned off $1.5 bn euros in 6 month bills at a yield of .2664% with a healthy bid to cover ratio. 

The bottom line, even after the downgrade, EU countries are not having much trouble selling short term debt. Who knows if there was ECB "round-about" intervention, they did make some interesting comments about the ratings agencies.

Overnight and this is kind of the strange part, the ECB's deposit facility hit another record high at $502 bn Euros. I wouldn't expect an increase if money, especially any LTRO money was being used to buy the short dated debt sold today. 


And as far as those Draghi comments:


Draghi Questions Role of Ratings Companies After Downgrades

Draghi said,

“I will never comment on ratings as such, but certainly one needs to ask how important are these ratings for the marketplace overall, for investors?” Draghi said late yesterday at the European Parliament in Strasbourg. “It seems to a great extent markets have anticipated these ratings changes and priced them in. We should learn to do without ratings, or at least we should learn to assess creditworthiness” 


And you may be wondering where I'm going with this...


As in the U.S., the ECB is forbidden to participate in direct/primary soveriegn debt auctions. They can buy all they want in the secondary market for many of the countries and support yields that way, but primary markets are off limits and that is what these auctions were today, primary offerings.


I mentioned Draghi's seeming disdain for the ratings agencies and also said, "Who knows if there was ECB "round-about" intervention,".


I mentioned this specifically because there were several primary auctions that came in with yields below that of the secondary market, this would suggest that the ECB "may" have intervened in the primary auctions via some mechanism like passing cash on to several banks to do the buying for them in a clandestine-type of POMO operation which if they bid aggressively enough, would cause the auction to come in below the secondary market yields.


Given Draghi's view on the rating agencies, given the past oddities in several auctions in which the ECB has been suspect, it's not so far fetched that they might want to do some damage control after the ratings downgrades.


Here is where it gets interesting...
This is the spread on the EFSF, note today it dropped from about $142.50 to the $138 area based on the solid auction. However, one the auction passed, the EFSF hit $146.94 later in the day, or the highest level since December 21st (the date of the LTRO). If sentiment was positive enough to have a successful auction and knock the spread down, why didn't it stay down? It appears there may in fact have been some intervention in not only the EFSF auction, but most likely all of them to, once again, do damage control and suggest to investors in bonds that the ratings downgrades had no effect on a sovereigns ability to rase short term borrowing at favorable yields.

Just something to chew over.


IWM Gives Up

By now you are probably familiar with the importance I place on the Russell 2000's performance, it's not just me, but when Bern-ak-acide was before Congress, he cited the Russell 2000's performance in what he called the "QE Wealth Effect", the idea being that the market had risen and caused average Americans to gain in wealth, of course we know this to be a ridicolous arguement and certainly well beyond the F_E_D's dual mandate of inflation and maximum employment, levitating the stock market via a shell game that was Quantitative Easing, is certainly not one of their mandates and the ridicolous volatility QE on and/or off created an envirornment in which many Americans simply could no longer have faith in free, fair and open markets and as we know, they left the market by the billions ($).

In any case, the IWM/R2k was also the basis for my pre-Santa Claus rally period analysis. The bottom line was then, as now, the defensive Dow Jones Index led the market, while the broad Russell (a much larger sample size then the Dow and a much more diverse group of stocks) lagged. The end result? No Seasonal Santa Rally, despite very high expectations for one.

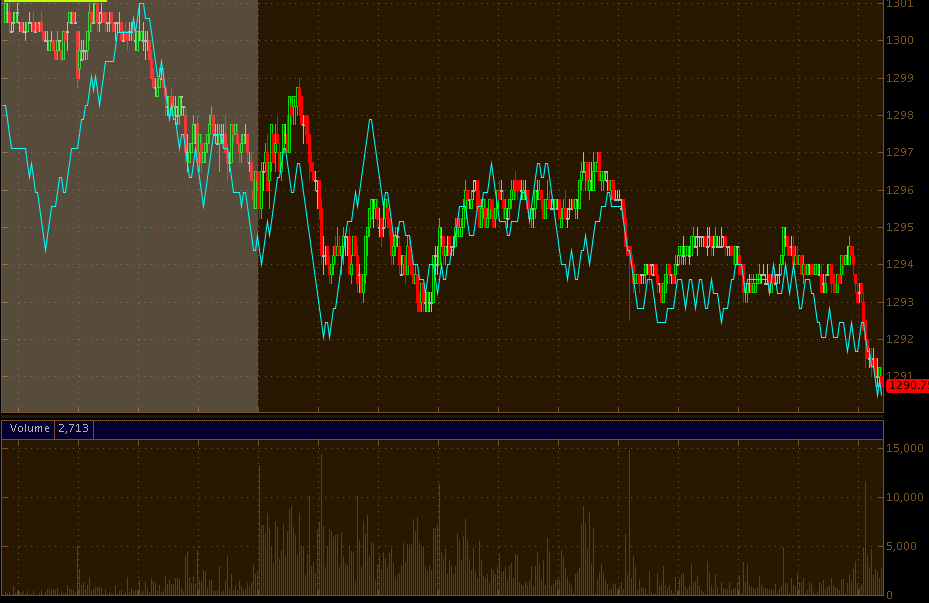
Looking at the market today, we see some green in the S&P, Dow and NASDAQ, although they did give up significant portions of their gains today. The Russell gave back all of its gains and then some to close red. On an intraday basis, from the IWM's high to the close, it gave back over 1.2% and it couldn't have happened in a worse place for the bulls.

Looking at the price pattern and volume, it's not hard to guess which way to the path of least resistance as the bearish wedge and the breakouts above the bearish wedge have all come on decreasing volume. In fact, considering today's gap up, even had the WM held onto its gains, the volume would make today very suspicious as volume hits a new low for the year. However, this new low in volume doesn't effect the bearish case, stocks need volume to rise in a healthy/ (Centrally) non-manipulated market, but stocks DO NOT need volume to confirm bearishness. It is said that stocks fall of their own weight, implying volume is not a major consideration, furthermore, lower volume is a distinguishing hallmark of a bear market.

If we look back to the last real bull market (void of manipulation by the F_E_D), we see what volume should look like.

Compare and contrast volume during the bull market starting in 2002/2003 vs the bull market starting in 2009 (while technically the 2009 market is considered a bull market by Dow Theory, I have a feeling when history looks back at this period, Dow Theory will have to be revised and the 2009 bull will likely be called "the biggest bear market rally ever" once we have a historical perspective).

I used a 200-day moving average on volume to illustrate the trend in volume compared to price.

As for the case for declining volume being a hallmark of bear markets, let's go back to the greatest bear in US market history.
Dow Crash of 1929 and subsequent bear market.

I think it is fair to look at the Financial sectors lost gains today as the sector was identified last week as coming out of rotation; while never attaining the same gains as the other 2 main industry groups, it did manage to climb in to the green and gave back 1.8% from highs to close.
XLF/Financials

Also noteworthy, if we average the gains of the 4 major averages, the Dow-30, SP-500, NASDAQ 100 and Russell 2000, we get an average gain of +.46%. Considering the gain, I find it interesting that the VIX was up 6.26% today (the VIX usually has an inverse relationship with the market).
The VIX is coming out of its own wedge, a bullish descending wedge. Low readings in the VIX imply complacency and as the VIX turns up toward fear, the market typically falls. The message of the VIX today was one of increased fear.

I'll have more for you in a bit, these are just some preliminary observations.

The 3 Pillars and the Market's Model

I refer to the 3 Pillars as being 3 of the most important 10 industry groups. The market can rally without Staples or Discretionary, but Financials, Energy and Tech are the 3 Industry groups the market surely needs to move. Just look at the composition of the major averages, the S&P is stacked with Financials, The Dow with some Financials and Energy, the NASDAQ 100 with Tech, these 3 need to move up together for there to be any kind of convincing arguement to be made.

Here's the model sen through out the market I keep talking about as represented by JPM
 JPM represents the bearish wedge with a false breakout that has now been confirmed, look at the major groups and averages that have some variation of this pattern.

 XLK-Technology

 XLE Energy

 XLF Financials

 The SPX

 The Dow-30

 The IWM Russell 2000

 QQQ/ NASDAQ 100

 AAPL

 Now for their 3C charts, XLK 1 min has called this gap very early as a false move seeing distribution, thus my earlier call to fade the gap.

 XLK 2 min is leading, so things are getting worse and distribution is picking up on a false breakout which is part of the reason to stage a false breakout

 XLK's major trend in the swing move has confirmed the bearish nature of the wedge and what t was being used for, distribution.

 Look how far XLK's 15 min chart has led negative in just the last few days!

 And the long term 30 min trend.

 XLF financials seeing distribution today

 Again the 15 min is leading badly on the breakout

XLE's longer term trend....

It looks like trouble and this area looks to be the same false breakout JPM printed, JPM is in a way a blueprint for not only what I expect, but what I have suspected.

BAC crashing through support

It seems like both my earlier idea to fade the market's gap today and the trade idea on BAC were pretty timely.

AAPL Trade, Right in time?

AAPL just broke some intraday support on large volume.

ES continues to move to new lows, definitely a change in character as the last few weeks have seen an afternoon melt up after a morning gap down, just as soon as Europe closed.

AAPL Trade Update

I went ahead and bought a few AAPL March 430 Puts.

AAP Trade

I'm seriously looking at putting on a short trade in AAPL via puts.

 This is a more extreme bearish wedge then most, as  have been saying, AAPL's rise has seemed to be fueled by short covering and as of last week, NASDAQ short interest hit 11 year lows. The wedge has the same probable false breakout and AAPL is giving a nice price move to open a position, while underlying trade remains weak.

 Intraday, a rounding top with correct volume.

 The 1 min chart which has been in confirmation is quite negative, leading to new lows on the gap up.

Long term daily, AAPL looks like it is seeing a lot of distribution.

3C charts getting worse at a fulcrum area

As I pointed out earlier, JPM looks like a model of things to come for the market as we have suspected this has been a false breakout throughout, in fact the pattern most averages, industry groups and stocks are breaking out of or have broken out of, were bearish to start with, increasing the probabilities of a false breakout, which is almost always the last thing to happen before a reversal in trend.

 DIA 5 min continues to lead lower

 IWM 15 min has been negative ever since the first hint of a breakout, it is now getting worse in 3C's underlying trade.

 QQQ 5 min is close to a new leading negative low on the day.

 The SPY 15 min chart tells the story behind the bearish wedge and false breakout, 3C in confirmation should be hitting new highs on this important timeframe, instead it is leading negative to new lows.


ES breaking to new lows on volume

The E-minis are breaking to new lows on increasing volume, 3C s confirming the move.
Note recent volume as ES makes new lows and 3C is lock step (confirmation)

TZA Shaping up

 TZA 2 min leading, looks like it is getting ready to move.

 TZA 15 min looks like it's been building support for a move.

 Both 30 min and 60 min below show a much larger region of underlying support.

Being that TZA is a short or inverse ETF on small caps, this doesn't bode well for the Russell 2k, which in turn doesn't bode well for the overall market.

Credit/Risk Asset Update

 Commodities are significantly underperforming again today.

 Here's the recent trend in commodities vs the SPX

 This is the long term trend and is evidence of the problems in China.

 Rates which should be in sync with the market have dropped significantly , even today they failed to respond to the market.

 Here's a long term view of rates, you can see when they are in sync and what happens to the market when they diverge like they are now, just look at the July/August plunge.

 There's no risk appetite in High Yield Credit, generally credit leads, equities follow.

 Even High Yielding Corporate Credit is selling off, evidence of an atmosphere where there is little appetite for risk, in fact we are seeing de-leveraging of risk in these indicators that tend to lead the market.

 Finally, as I mentioned Friday, Financials are coming out of sector rotation, today shows evidence of that with my custom financial momentum indicator lagging the market badly.

This is when financials were leading the market as their rotation climaxed.