Yesterday was the Dow's worst day in the decline, the 1-day ATR or range yesterday from the high to low was $624.24, today's range was an amazing $626.92
I updated the long position stop on VXX last night as I had a feeling this might happen. 10 min negative divergence in the VXX sends it close to daily lows
The short term charts are very difficult to get any read from as they are almost perfectly in line with trade, it's the intermediate term charts that seem to be providing support.
As I showed in some market updates and the VXX update, I expect there to be some nervousness/selling running up to the Fed announcement, for example...
This white arrow shows a loss of 85 points in the Dow-30.
And here is the positive divergence in the VXX I showed earlier, suggesting we'd see such behavior.
However, the bigger intrady picture also shows some interesting charts...
We just saw one of the most successful 3 year auctions in over a year with indirect bidders stepping up to take down nearly 48%, up from 34.5% in July.
The VXX is testing an important support level, it makes sense to see volatility around this level as clean breaks are rare.
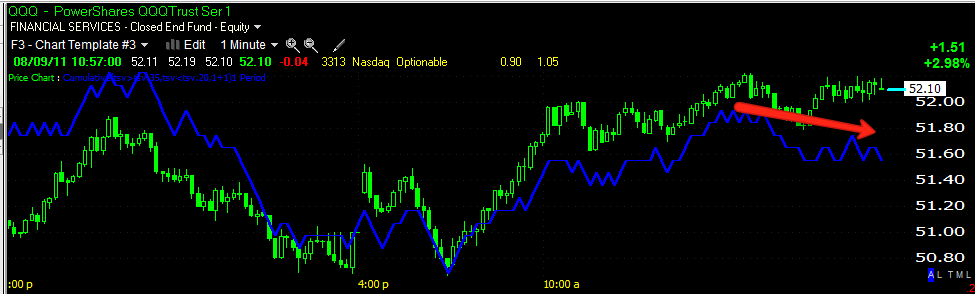
The 1 min chart shows an intraday positive divergence, I'm guessing there will be some "Risk Off" trade running up to the FOMC policy statement.
However, the more important (bigger picture) 10 min chart that I showed you earlier s showing what appears to be some trouble for the VXX ahead. Remember, the VXX is for short term volatility trades and trades inversely to the market.
USO's turn down on a negative divergence, as usual on a false upside breakout at the yellow arrow. This is the first real sign of any life in USO over the past several days.
USO 10-min
USO 5 min
Some of this may be due to the Dollar Index or UUP losing about 1% over the last 4 days, but I have feeling there's more to it then just that.
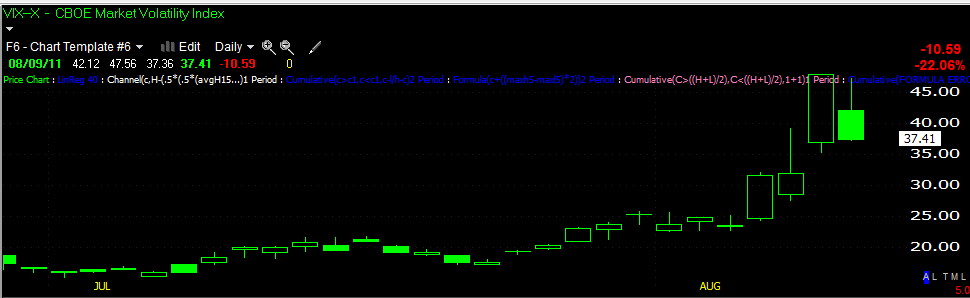
I fully realize it's early in the day and the defining even t will come this afternoon upon the Fed release, however, I can't help but noticing the action in the VIX/VXX.
Just like in March, the VIX Spiked yesterday and formed a Harami candlestick reversal thus far today, the red line is the SPY.
I also updated the stops last night for trades including the VXX which was originally a swing trade that I said I felt it might have more potential, which it did. However, it is showing some not so hot 3C signals today and over the last few days. The VXX, like the VIX, trades inversely to the market.
It looks like there have been some sudden shifts in SLV.
You can clearly see a distribution period in SLV that was reversed on a deep negative divergence on a false breakout of a small double top (yellow arrow)-almost what we see every time. However, what is rare on this 60 min chart is the positive divergence formed in August. Usually 3C would be telegraphing stage 4 decline and making lower lows in confirmation with a drop in prices, instead t has gone positive in a somewhat sudden shift.
Recall yesterday's bearish ascending wedge and my thought that we would see an upside breakout from the wedge (the opposite of technical analysis dogma), followed by a downside resolution on a head fake breakout. Yesterday we didn't get the breakout, at least not to any meaningful extent which would fulfill the purpose of such a breakout. This morning we have the anticipated breakout in to a negative divergence. GLD slipping below $167 could be troublesome.
Many of the charts you see here at WOWS are my proprietary indicator 3C which reveals underlying institutional money movements and often contradicts price. To understand the annotations made on charts, you must first understand that 3C has no numerical value, it is a pure divergence indicator. Positive divergences represent accumulation by smart money, negative divergences represent distribution by smart money and when 3C trades with price, that is trend confirmation.
The chart annotation system is simple; white arrows represent relative positive divergences, red arrows represent relative negative divergences and green arrows represent trend confirmation. When 3C is in a white or red box, that represents a leading positive or negative divergence, leading divergences are the most powerful.
We analyse 3C in multiple timeframes, the longer the timeframe the stronger the accumulation. 1-2 min timeframes represent intraday moves, a 5 min timeframe can represent a day or two and 15 min timeframes average trends of a swing trade nature. 30 and 60 min charts can move the market for a month or more and daily charts can be over a year.
You'll get use to seeing the charts and understanding how the multiple timeframe analysis works and works well.
Welcome to Wolf on Wall Street.
The trades featured here are meant to maximize returns with the least risk and highest probabilities. Unless otherwise mentioned, all trades are meant to be executed at market. I prefer long-term trending trades which perform well in rising markets, but really stand out in declining markets. However, we get occasional one day gifts 30,40,60% 1-day gains. I'd urge you to consider taking some or all off the table in such cases, the markets don't give gifts like that often or for very long. Most of the returns that make the system outperform so well come in short-entry trades. If you are opposed to short trades, this is not the system for you, unless you are ok with buying an inverse ETF. If you would like more information about the truth about shorting stocks, just email me.
Risk management. I recommend a specific and consistent risk management approach to all positions. In most cases we try for 2% risk money (2% of portfolio) unless such a position size exceeds 15-20% of overall portfolio in actual position size. Each trader is different and each has a different allowance of open trades. I like to keep the overall money in the trade around 10-15% of portfolio per position in case of gaps against you. Stops are generally executed at the end of day and I personally never place a stop order, all my stops are mental; remember, the middle man gets to see everyone's cards. When you are not in tune with the market or opportunities just aren't that spectacular, I take my risk per position down to 1% or even half a percent of portfolio value.
Each trader is different and must determine their own level of comfort with risk. I do have a channel stop which I provide to TeleChart/StockFinder users for automated stops, I appreciate you using my links to sign up if you do. The Trend Channel catches trends and works well as it automatically adjusts for each stock's volatility. Arbitrary exits based on nervousness about the markets WILL decrease the portfolio performance dramatically. This system will not ever get you in at market bottoms or tops. The recent 1 year performance against the Russell 2k buy and hold had the system beating it by 3:1. Ultimately it is up to you as to how you proceed, but I'm always available to help you determine what might work best for you.
I do use other scans and systems when market conditions warrant their use and may change strategy with market conditions.
The MOST IMPORTANT tool you have to bring you long term success is RISK MANAGEMENT. There are plenty of articles linked at Trade-Guild.net on Risk Management. We can be wrong 75% of the time and still outperform the market with solid, consistent risk management.
Position Sizing
The position sizes noted in the positions @ 2% risk of portfolio are based on a $20,000 portfolio-adjust as needed. Due to tight stops, there is the possibility, even probability that one position could take up the entire portfolio. You need to decide how many positions you want to trade and reduce the position size according to that. For instance, if you want to trade 5 positions in a $20,000 portfolio, no one position should be valued at more than $4,000-not risk money or 2% rule, but share price entry x shares.
Is interest rates about to start going up?
-
Yes, I know - it does not make any sense - FED is about to cut
rates...but....real world interest rates are not always what FED wants it
to be.
Futures Update BR-EXIT Edition
-
So the conventional wisdom couldn't have been more wrong. Those chasing
risk and closing hedges couldn't be in a worse place right now. I would
still remin...
This website may include stock and market analysis. Any opinions, ideas, views and statements expressed here are opinion only, subject to change without notice and for informational purposes only. Trading stocks carries a high degree of risk. It is possible that an investor may lose part or all of their investment. Accuracy and timeliness of any information is not guaranteed and should only be used as a starting point for doing independent additional research allowing the investors to come to his or her own opinion. Nothing on this blog is to be considered a buy, hold or sell recommendation. *Wolf on Wall Street portfolios are PAPER TRADED, no real money is used. Any investments, trades and/or speculations made in light of the opinions, ideas, and/or forecasts expressed or implied herein are committed solely at your own risk, financial or otherwise. Results are dependent on market conditions, timing and trading style. Comments posted on Disqus Threads are not moderated and are not representative of opinions of authors of this site.
Translation: You are responsible for your own investment decisions. Not anyone else. YOU.
Position disclaimer: Authors might OR might not have position/interest in securities mentioned on this site!
Affiliations:
Authors of this blog might receive commissions and other considerations from:
Correspondents' emails are strictly confidential. The third-party advertising placed by ad networks may collect information for ad targeting. Links for commercial sites are paid advertisements. Blog links on the site are posted at my discretion, without compensation of any kind.


 | Theme by Thur