Wednesday, June 29, 2011

Closing Stats

I'll keep this brief and please keep my 2nd to last post in mind, "A different perspective".

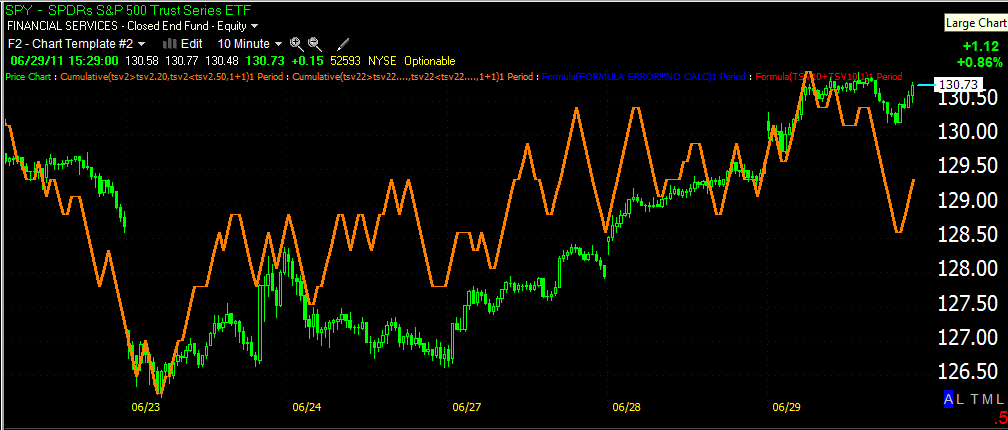
Today I was nearly sure that we'd see a dominant Price/Volume relationship. Interestingly, the SPY, DIA and QQQ all closed up on higher volume, but the S&P-500, the DOW-30 and NASDAQ 100 closed up on lower volume.

For all NYSE stocks, Close Up/Volume Down was the dominant theme and when I say dominant,  don't mean it was the highest, but rather t shows dominance, it is significantly higher then the other 3 relationships. The Dow-30 had the same dominance, but the Russell 2000, the S&P-500 and the NASDAQ 100 had no dominant theme.

The most important perhaps is the NYSE components as it is the broadest measure.

Today I have a different take on the dominant P/V relationship, we've had 3 days of solid advances and broken resistance, the fat this market hasn't moved to a strong, bullish theme like Close Up/Volume Up is telling us something about the internal action of the market, it's bearish. This theme could be excused a few days ago when no one took a break of resistance seriously, but now that we have it, the market hasn't turned to bullish internals.

This all actually works out well with the idea of the bounce, which was to be able to short into price strength, we don't want market strength. So the internals as far as the P/V relationships are actually looking pretty good for us.

That's the short of it.

The Miners Trading System Signal

Once again, unchanged, both systems are long NUGT for a decent 4.28% advance today.

While talking about the miners, I mentioned HL as one of the better looking silver miners yesterday, today HL broke put of its short term consolidation. No matter how short or long, remember that "5 points of contact with support and resistance in the consolidation", it worked like a charm today.


Back to the trading system....
 Above are the current returns for system 1 and 2, more importantly, even though we have to expect to see "pullbacks" in the equity line, there are no lower lows in either system. System 1 is now returning 85% over a 7 month period and system 2 at 75% for the same period. Simple buy and hold of NUGT would have lost -24%

And the S&P-500's return over the same period? 6.05%

Now that's some serious outperformance!

I'll fill you in on the results of the silver miners test.

A different perspective

The idea for almost the last 3 weeks has been a market bounce to an area around the 50-day moving average. Last week we had two days in which we couldn't break resistance, 3C was showing and I had said, "we need to pullback, get some accumulation and make another run to break resistance. That happened! Also in my nightly recaps, I've been saying volume isn't going to pick up until the shorts start to cover and the shorts aren't going to start to cover until we break resistance. Today we broke resistance and guess what? Volume is up. I'm not looking for a strong market move, I'm looking for a bounce to short in to, so if the intraday data s saying this bounce is becoming weaker, why should I care? So long as we can hold the breakout level and target the 50 day moving average or better, mission accomplished, no matter how we got there.

So there's the breakout, volume is higher, we really don't want a strong market going into the 50-day average or above, as that's where we want a chance to short stocks, so I think maybe I'm a little too wrapped up n the details of how this is going down, and missing the big picture, IT'S GOING DOWN the way we've been waiting for, for nearly 3 weeks!

Yeah, sometimes we get lost in the lines.

Market Update

Lets not forget it's end of quarter window dressing (the art of looking smart), although prospectus related trades should already be wrapped up due to the T+3 settlement dat, running the returns is still in effect.

Here's a look at the SPY and some seemingly not so important information, but clues are often where the masses miss them.

 SPY broke the 50-bar 5 min moving average, something it hasn't done the last two days (although I wish it had). That average is now going to be a resistance zone, the SPY is just lingering above it, but remember resistance is not an exact number, it's an area.

 The 5 min is negative, a test of the highs here will give us an idea of what the 5 min chart will do (improve or not)

The same goes for the 10 min chart.

Right now, the SPY is looking better (3C wise) then the Q's or DIA so we don't have really good confirmation, that's why the test at the highs or new highs will be important.

While Institutions will want to juice returns, there are still longer 3C positive divergences that could still get us up to the 50 day moving average. I suppose breadth falling apart in to that advance wouldn't be horrible as the whole idea of this bounce has been to get better short positioning.

Treasuries

A 3rd disappointing auction just wrapped up, today the Treasury was offering 7 year debt.


The bid to cover came in below the average at 2.62 which incidentally was the worst bid to cover since Q1 2010 when QE1 was wrapping up. Indirect bidders (Foreign Central Banks mostly) came in low at 32%, the worst indirect participation since March of 2009. The auction was described as "atrocious"!


Yesterday I mentioned the situation in treasuries in this post. It may be worth a quick re-read when you have time. Some of the long plays I mentioned yesterday to take advantage of this obvious change in sentiment included the following...


 DLBS

 PST

 TBF

TBT


All are at a gain today, 3 of 4 are posting higher volume and 3 of 4 are optionable.


It looks like a change in sentiment is underway.


As yields rise, we have to consider the consequences of Carry trades being shut down, such as the Dollar/Yen Carry trade. Should the carry trade be unwound, it should push the dollar higher and that of course typically has an inverse relationship with most asset classes.


The thing to take away from this if anything, is the change in sentiment and what it will mean for the market going forward and of course, how we can best position ourselves to take advantage of it.


NASDAQ Breadth

As I suspected from the 3C readings in to higher prices, breadth has been falling apart, meaning fewer stocks are participating in the advance or said another way, the market is getting thin. These are some of the concerns I've had the last few days with the market advancing on lower volume in a parabolic fashion, we really needed a decent pullback in the short term before trying to tackle resistance today-the market would have been in better shape for the move.

 The NASDAQ 100/ A/D ratio peaked this morning and haas been on a downward trajectory since. Also notable s the fact the NASDAQ hasn't added much in terms of price gains since that point.

The % of NASDAQ stocks making new highs also peaked (on a 5 min scale) this morning and has been headed down since. This is what happens when a market advances relentlessly without normal, healthy corrective pullbacks.

 Here's today's 1 min 3C for the Q's


 When a 1 min negative divergence persists without a pullback, it generally spreads to the longer and more important timeframes, this is the 5 min now negative.

And the 15 min. is also negative.

You can see now why I was hoping for a pullback yesterday and the day before to establish a base and wring out the excesses, now they'll likely be wrung out by a deeper correction.

TICK Index

The TICK chart just got a bit nasty...

I'm loading up my breadth charts now, but I suspect this may be the start of a pullback that 3C has been signaling

BRKL Trade Idea (Long)

This is an interesting looking chart...

The price and volume pattern in the white box is similar to a bull pennant, a bullish consolidation/continuation pattern. It's also very close to the apex, meaning a breakout should come soon.

The daily chart shows 3 positive divergences, 3C, Stochastics and RSI

The hourly chart looks very positive as well.

This is my crossover screen which caught the move down and is now signaling long

ADX Crossed down below 40 signaling the end of the downtrend. The Trend Channel, which held the last move, has a current EOD stop at the $8.85 area. You could wait for a breakout above $9.20-$9.25 on good volume and also place a tighter stop around $9.15-$9.20, depending on your trading style and risk management.

I'd definitely set some price alerts though.

Market Update

I'm not liking the looks of these charts.

DIA

QQQ

SPY 1 min

SPY 5 min.

So far the 5 min charts aren't looking as bad, the charts in XLF, XLE, and XLK are all showing some negative divergences as well.

This is why I would have preferred a base yesterday, right now any pullback is difficult as it would most likely need to hold the breakout levels as to not look like or actually be a false breakout.

Keep VRML on your radar

Late yesterday I brought up the VRML (long) trade idea, I didn't have a lot of time and just wanted to follow up a bit.

This hourly chart shows the price consolidation, a solid breakout should lead to an interesting move.

I rarely see 60 min charts this strong.

Keep in mind this is a speculative trade, but there are a number of places a stop can be placed with fairly low risk.

Also keep in mind that I personally view any double digit gains within a day as a market gift, and I usually book at least enough to guarantee a profitable trade, the rest can be managed with a trailing stop.

GLD/SLV Update

After retracing about 30% of this morning's gap, both SLV and GLD headed higher. It looks like there's going to be a correction in the area. Remember that corrections/consolidations can occur through price retracement or through time in lateral trade.


The intermediate and longer term charts are still bullish for more upside

Austerity Vote Passes, But Will Greece Survive?

I don't mean just financially, there are now reports that the Greek Finance Ministry building is now burning. This in addition to a wide range of strikes across their service industries, including airlines, public transportation and a host of Union and government jobs.

Market Update

 SPY 1 min negative divergence

After a strong move in the TICK chart, the trend is starting to break-look for a pullback.

USO Update

So far this morning, that's one heck of a move in USO, especially if you used a leveraged ETF like UCO (up nearly 6%)


 Here's that resistance level  I mentioned (gap resistance) and the small negative divergence, USO consolidated for about 10 mins. and broke right through.

 Here's the daily chart.

 The move s very strong and getting very parabolic as it trades in the 2nd BB channel. These parabolic moves tend to take a break at some point.

 For traders looking for a tight stop, I'd say this 50 bar (1 min) will preserve a lot of profit.

For those who are willing to ride out a consolidation, I think this 50 bar (5 min.) might work well. If the trend consolidates and moves up more,  traders choosing this stop will probably have to widen out the stop on the next leg up as subsequent pullbacks tend to be deeper.

USO Update

Yesterday I showed some USO charts that suggested we'd see some strength in Crude for reasons I outlined in this post.

So far we are seeing that strength materialize in USO.
 USO has put together two strong days thus far, volume today looks set to eclipse yesterday's volume, hopefully we can get another strong close near the top of the range like yesterday.

 The confirmation of the USO 2-day uptrend, there have only been some minor negative divergences which led to normal, healthy small corrections. We are at another area now in which it appears we may see another small correction.

The 15 min chart still looks strong and in a leading positive position, however, we are at a level of gap resistance, this is probably why 3C is showing a small negative divergence.

NUE Follow Up

If you read my Monday night post on NUE and yesterday morning's follow up you might be long NUE right now and pretty happy. NUE has broken out of the larger pattern after triggering a buy signal early yesterday, so far it looks like a decent breakout.

NUE breaking out today on a pretty strong move considering the broader market

 Here's yesterday's buy signal and today's breakout of the larger pattern.

So far the trend is in line with 3C, meaning there is no visible underlying action that would suggest the trend is weak.

And the longer term 15 min chart is still in a leading positive divergence.

I think you have to stay nimble in this market right now and I would still consider placing a trailing stop on the NUE trade. 

GLD/SLV Update

Both GLD and SLV look like they want to do a little backing and filling of the gap this morning, their longer term charts still suggest they have more upside to go.

 GLD 1 min is pretty much in line, there was a positive divergence yesterday near the close, this s the kind of action the market was missing yesterday to give it support today.

 GLD 5 min is quite negative, I imagine it will fill most of the gap

 The 30 min chart though is still very strong and suggests more upside

 SLV 1 min is largely in line with price.

The 5 min is negative, again I'd expect some filling of the gap this morning.

Still, the intermediate and longer term intraday charts are still positive ( these are the larger view beyond intraday pullbacks)