Friday, April 1, 2011

WARNING:Hacked Websites.

Neither Wolf on Wall Street or Trade-Guild.net will ever offer security software or pop-up windows.

Be aware of this latest Hack effecting potentially 1.5 million websites

Once Again, the BLS Faces Gallup

I think it's pretty clear the BLS (especially considering the rate of revisions to their data) certainly has a dog in the fight, but does Gallup? I don't think so.

Gallup finds unemployment at 10% and underemployment (the same as U6 data) at 19.3%

You may ask why the BLS would want to mislead people. The Fed's in a pinch with inflation and the trillions of dollars spent in QE and other measures should show some effect. Consider for a moment that they had no effect and the Fed needs to change policy, perhaps we have some face saving efforts underway.

The Fed's Big Secret

After the Supreme Court ruled on a Freedom of Information Act for documents pertaining to the Fed's Discount window lending, the Fed was finally forced to hand over the documents and why did they want to hide this?

As Americans were losing their jobs, homes and lives as they had known them, the Fed lent over 70% of the discount window money to Foreign Banks! In the top 5 borrowers, only 1 was a US bank.

Here's the story

Ron Paul may have just found a platform to run for president.

3C data

 AAPL is catching a small positive divergence. Note AAPL's chart just before the breakdown and compare to the Q's and SPY

 DIA, several neg. divergences have sent DIA off it's highs and rally attempts, there's a small pos. divergence now.

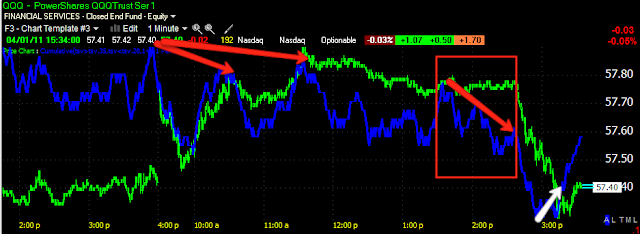
 The same is true for the QQQ, but look in the red box, just before the break down, a fairly sharp negative divergence, I'll come back to this.

Here we see the same thing in the SPY.

When market's are through their distribution cycle, there's usually a catalyst  or a fulcrum stock for the day that sends them into a reversal, today it appears to be uncertainty about boots on the ground in Libya going into the weekend.

However, the point of those red boxes on the SPY/QQQ are to show what I believe is the speed of the information curve which we are always behind, but it appears that Wall Street got their hands on the information just minutes before it hit the wires and they took action as can be seen by the negative divergences.

Latency is what HFT trading i all about today. As I've mentioned, my Uncle worked for a major Wall Street investment bank and my cousin works on a black box trading system. A few years ago he was telling me about hubs they were installing in different cities (they are based in Atlanta) and they were spending millions of dollars to reduce latency, by nano-seconds. That's how important that edge is and they aren't one of the bigger Black Box firms.

AAPL's Close

We've known on the daily 3C chart there's been some trouble in AAPL, you don't even need 3C to see AAPL is making lower highs/lower lows (downtrend), but the test of the trendline which failed so miserably this morning was not good news for AAPL. Should AAPL close like what we see now (it may gain some back before the close) then we have a very nasty Bearish Engulfing Candle at an important area for AAPL. And... if it's important for AAPL, it's important for the NADAQ. Taking that 1 step further, the markets are highly correlated and the 4 major averages tend to move together, so it's bad for the S&P, the Dow and the Russell. I've never seen a stock with so much influence on the market. Perhaps the NASDAQ should reconsider their weighting. By the way, if you want the exact weighting which is valuable information (especially for those who want to manipulate the market short term), you can get the formula for a mere $10,000. Who do you think they are catering to and just how important is it to keep that information out of the common person's hands.

Shall we start a collection?

Fib Retracement

Well over a 61.8 retracement on the DIA, that's a lot of ground to give up that quickly and will leave quite a few longs at  loss, probably including some institutional money. This is also what happens in a market that has been manipulated so badly that there is no significant short sellers to provide a bid.

Next Question, How many stocks is this effecting-BREADTH?

 The lowest tick reading since the 23rd of March

 I'm guessing the most extreme readings yet on % of stocks above/below their 50 bar moving averages (1 min as the data is new)


And the count of new highs, new lows over a 250 min. period, again most probably the most extreme reading in this entire bounce.

NFP Number

I mentioned earlier that retail will love the NFP number, "Recovery!! Whooppee!!!", but Wall Street will have a different take, "Does this mean you are going to raise rates, we don't get free money to put into risk assets and therefore actually have to take risk" as well as the fact that draining liquidity from the market will also mean that Wall Street will have to unwind the massive leverage they've been utilizing, which means selling.

Another Reverse Repo was conducted today to drain $1.8 billion in liquidity which is really a drop in the ocean, but it's the 3rd time this week. So what's the Fed up to? You might think that they are sending signals to the market, but it seems this fed is so full of leaks that Bernanke is more likely just to call Jamie Dimon, Bill Gross and about 42 Primary Dealers and just tell them, "We're draining liquidity, act accordingly". In fact, it wouldn't surprise me if those calls went out about two weeks ago.

In any case, the NFP number is not the good news that most retail would think, at least not for the market right now which has been on a sugar high of FREE!!!! money.

A Possible Catalyst...

""The European Council on Friday approved the decision to mount an EU military operation to support humanitarian efforts in Libya, if asked to do so by the United Nations. "The EU will, if requested by the UN Office for the Coordination of Humanitarian Affairs (OCHA), conduct a military operation in...order to support humanitarian assistance in the region,"


An escalation of the Libyan conflict that may turn into more then an air war... 


The nasty sell-off is what you get when there's no breadth, no solid long positions, no volume confirmation and a bit of uncertainty in the market. 

Sometimes I Just Can't Type Fast Enough

That's because I learned the 2 finger, "Hunt and Peck" typing methodology. While I was putting up that last post, AAPL broke and took the NASDAQ, the SPY, and DIA with it.

 AAPL and the volume...

The Q's

Now we will see if all those negative divergences and poor breadth is catching up with the market. It's too early for this to be day traders exiting for the weekend.

AAPL

AAPL is an important stock to watch just because of it's weight on the NASDAQ 100, it alone can move the NASDAQ red or green for the day. I've been watching today's chart unfold with some interest, but also some trepidation.

AAPL gave up the opening gap pretty quickly, it went on to form a triangle (which has me a bit cautious being so obvious), and has since broken down on some volume. There are a high number of false moves centered around common technical price patterns and a triangle is as common as you get. AAPL is close to testing the last low put in, WATCH FOR VOLUME if it breaks it. This could have some serious consequences on the NASDAQ 100 into the close.

TSLA Update

TSLA was featured March 29th (check out the post)

So TSLA looks to be on the way to our target, it's not going to go straight up and there's still an opportunity on the upside for new trades. I would however wait for a bit of a pullback.

The target here is $34.

WU Follow Up

I featured WU Wednesday this week and ever since it's been behaving badly with ZERO relative strength.

Here's an updated playbook on the possible short trade (see the linked post above for the reasons I didn't/don't like this stock).

 The top formation is there and prices are close to a support zone, I'd anticipate a bounce of that level, although there is a slim chance it will just slice through support. I'd prefer to short this on a bounce so if it bounces off the trend line, I'd be paying attention.


 This more or less is a definitive sell signal. The bounce could hit the yellow/blue moving averages, but I'd expect if it does bounce, it'll be higher which is better for a short entry.

The red trendline is approximately where I'd expect a bounce to run to, possibly creating a mini-triple top, but I think more likely a descending triangle.

If you like the trade, maybe put some price alerts on it and feel free to email me any time.

Breadth

We are far enough into this advance that the big picture for the advance can be seen more clearly. These are all breadth indicators I have setup on Stockfinder for the NASDAQ 100

 Starting with the 1 minute advance / decline ratio which has shown negative readings the last several days as we see here, fewer NASDAQ 100 stocks advancing into higher prices.

 Now that the trend is developed, it's easier to look at the 15 min chart to get a feel for the overall advance and we can see that the daily charts like the one above have been accumulating  into the longer 15 min chart.

 Here's another we've been watching, the 250 bar new highs/new lows on a 1 min scale.

And the same indicators on a 15 min scale shows some unusual activity today.

 This is a custom Breadth indicator , the trend early in the advance is clear as is the trend now (15 min scale)

 Here's a McClellan Oscillator, note the positive trend at the start of the advance and the trend as the advance matured.

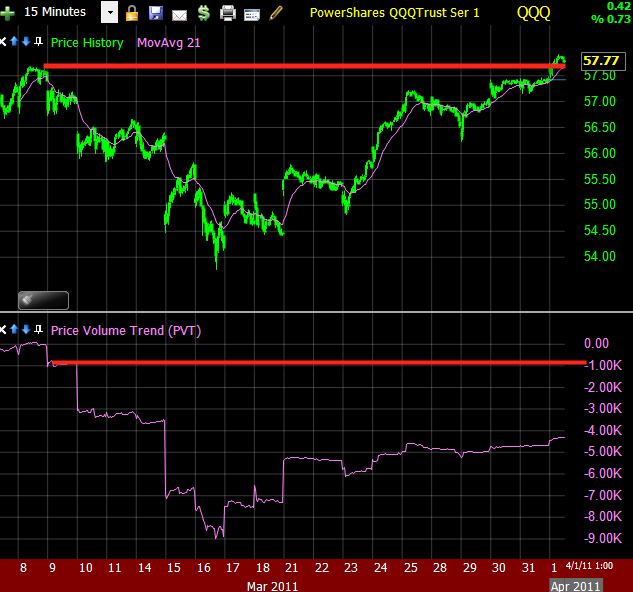
This indicator is PVT or Price/Volume Trend, it's been pretty bleak throughout the advance when comparing the indicator to price at two relative levels. A simplified explanation is that volume just hasn't been there in the advance which is taken to suggest that traders are less willing to chase higher prices.

Also the PMs

 GLD 1 min

SLV 1 min (SLV STILL, even here looks stronger)

Time for Some Intraday Downside?

I want to take a look at the breadth chart, but I figured I should get these out now.

 DIA 1 min

 QQQ 1 min

SPY 1 min

Leaks Everywhere and that's the Market

This a.m. the possibility was raised here (raised yesterday in many venues) of Kocherlakota having seen a leaked NFP release from 8:30 this a.m. As Morgan Stanley said, "It's impossible, only the Fed chair sees the numbers the night before and wouldn't share it with other governors, much less regional bank presidents". Now the issue of Bill Dudley of the NY Fed having seen the same leaked material is floating around. The issue centers on his speech which was embargoed at news outlets, there was only and hour and a half between the time he could have filled in the NFP numbers for today which were mentioned and that time drops substantially when the fact that the speech was already at news outlets and embargoed so it is likely that he too saw the leaked numbers presumably from Bernanke.

It seems to be a question of semantics and who really cares if a regional Fed president sees a NFP release a day early. However, the more concerning question is the honesty and integrity of the news outlets like for example, CNBC who hold the embargoed speech in their grubby hands. Most of these guys are Wall Street alumni and you know as a reporter, being the first to break a story is a big deal. So whose to say they don't reach out to their former colleagues/golfing buddies on Wall Street with a little quid pro quo?

That's the reality of our markets. That was always the first issue I raised on the first night of my technical analysis classes, I showed them video coming from Cramer's own mouth of how he manipulated the market as a hedge fund manager and how others do routinely and best of all, his warning to all aspiring and current hedge fund managers, "If you're not willing to do it, you shouldn't be in the game".

This is why I follow the charts, I don't watch CNBC, and I use my time building indicators that help me understand what Wall Street is doing, why they are doing it is a question that won't be answered until it doesn't matter anymore.

Just to remind you, in the recent past, others such as PIMCO's Bill Gross have had some brilliant predictions the day before an economic release was due out so there's many roots to this garbage, although I suspect Gross is a lot closer to the trunk of the tree then down in the root system.

March ISM at consensus, inflation as expected.

ISM came in at consensus, but once again you miss the big picture if you don't take a look beyond the headlines. Prices paid on the last ISM (which was an increase from the previous report) was 82, consensus for this report was 82.9, actual print came in at 85!

New orders declined about a point to 63.3 and as you might expect, construction spending dropped (think LEN short).  Employment did grow at a decent pace, but as margins continue to contract, lay-offs are usually imminent.

Prices Paid has been trending up steadily since 2008, accelerating in 2009 (Bernanke's Quantitative Inflation) and now prices paid are only about 5 points off multi year highs, the chart I saw only went back to 2005 so it could be even longer.

Some Members / USO Traders Are Getting Paid

On March 17th, I said USO had enough accumulation in it that it should be able to take out the March high;  I've said the same thing 19 more times since then. Guess what USO just did?

 There's the March highs taken out, there are several traders who have been in on this move since then and have stuck with it (I believe some options traders too).

 We expected the pullback in February even as the trouble mounted in the Middle East. The Reason? Dynamics in the Middle East caused a shift in the outlook of oil and institutional money needed to get a position going to take advantage of it, so even while events got worse in MENA, oil pulled back and institutional money accumulated a fairly large position.

 Here's that accumulation and we saw the same again off the March highs (the divergence is there, I just haven't marked it).

On 3/23 a pullback for USO was posted, "Based on the closing action, the daily candle and the resistance zone of the March highs, this is an ideal spot for USO to pullback a little, it wouldn't endanger the uptrend and would be good to wring out any excesses."  The 23 is the doji candle just to the left of the white box. The target was the 10/22 day moving averages at the red trendline. Note that this was a 4-5 day pullback and it was completely normal and healthy, although during it I'm sure it caused some concern.


Now we have new highs. We could certainly experience some volatility as is usually the case when an important technical level is broken, it's just too rewarding for the HFT firms, however, just as we've stuck with this trade since February, I continue to believe USO will post even more gains so I remain bullish on USO and for all of you who held in there, congratulations.

LEN Follow Up

I posted LEN on Wednesday this week as a potential short saying the following,

" LEN has also shown less then ZERO relative strength. At this point a dead cat bounce would be most welcome in LEN and I think it's likely."


Today looks to be the start of that opportunity.


 Up 2.7% so far today....


Here's the 15 min chart, showing top side distribution and the positive divergence at the bottom for a dead cat bounce. I think it'll bounce for several days and I wouldn't pull the trigger yet, but I'd keep it on a watchlist and when the bounce momentum fades and negative divergences show up, I think this will be a great opportunity as the next leg down should take it out of the topping volatility zone.

Semis Once Again Showing No Relative Strength

The past few days I've been writing about the lack of relative strength in the semis and yesterday featured INTC.

 Once again, INTC is off on its own, wondering downhill.

Here's SMH (Semiconductor ETF), that's a waterfall on the opening gap.

Here's the SPY vs SMH (red) this a.m.

I think all the hawkish Fed talk this week has semis worried about rising rates which is a huge drain on many of these companies as they depend on borrowing for R&D. It remains to be seen if the market will show similar concern, I suspect it will.

Precious Metals

I'm not 100% sure what caused the PM's to gap up yesterday, but there were several warning signs with negative divergences at the highs of the day in both. SLV still remains stronger then GLD, presumably from increased demand in countries like India.

GLD
 GLD jumped back into the zone between resistance and support, it's now fallen back below  on some volume.

 Yesterday 3C didn't confirm any of the move yesterday.


SLV
 SLV jumped back above resistance to the breakout area, today it's in the same zone GLD was in yesterday and is likely to bounce around between support and resistance here for a bit.

 3 times there were negative divergences in SLV, each time at an intraday high or attempt at intraday highs.

On the 15 min chart both breakouts have shown distribution, 3C (compared to price) is now in the lowest position on this chart.

USO Early Look

USO is down a bit today, that can be expected on US dollar strength, but there was a gap created yesterday and filling that gap is not out of the question. If the gap is filled, USO still remains in a positive position; I would probably view it as an opportunity, however it's still very early.

Keeping it in perspective-USD

Yesterday afternoon I published this post after the Euro had seen an earlier parabolic move (it's worth reading the post again just to get a feel for some of the dynamics that caused this move)

After yesterday's late day accumulation and a signal in the Euro that often leads to a downside reversal, this a.m. the dollar is once again higher by .83% (UUP)

UUP has broken the first layer of resistance this morning, the second (the gap) isn't far off.

NFP Blows Out Consensus

Non-Farm Payrolls come in at 216k vs. consensus of 190k. Rumors are running rampant that Bernanke shared the numbers with Regional Fed Pres. Kocherloakota, which he presumably leaked and thus his hawkish statements yesterday about the Fed Funds Rate at 75 basis points in 2011.

Not that this is going anywhere, but only the fed chairman is supposed to see the numbers the night before. While pre-market is up right now, this is presumably not good news for the market and any hope of QE3, which would put an end to the speculative equity/commodity bubble. We'll see how it plays out. The report was not all good news as several sectors are lacking, manufacturing for example came in below expectations. Also the work force participation rate is the lowest in 25 years at 64.2%.