Wednesday, March 28, 2012

AMZN Follow Up

AMZN is another trade looking like a head fake move, I like these trades because you can get good positioning and they tend to move fast and far.

 Here's the breakout over $200 we were looking for and the 3 candle set up with a shooting star reversal candle yesterday and a bearish engulfing confirming candle today, the candle today closed right around short term support.

 Here's the 1 min intraday positive divergence at short term support.

 While the more important 15 min chart is leading deeply negative.

This is another trade we may be able to short at a little better prices intraday, a break below$200 and the $197 area should send AMZN down fast.

BIDU Update

We looked at BIDU earlier in the week and saw the potential for a false breakout from the large triangle, this is another that seems to be setting up a nice head fake trade.

 Here's the large triangle formation that is most likely a top, but nothing is what it seems in price action. We expected a head fake breakout move and it looks like we are getting one.

 This is a very bearish combination of 3 candles that is a known reversal set up. If we get some upside volatility tomorrow off a market bounce we may not see a decline tomorrow or at least not early, but all the pieces are falling in to place.

The positive divergences in BIDU that sent it higher and the leading negative that suggests the breakout move is being distributed and quite strongly.

A close below $145 should confirm the head fake breakout, although we may get intraday signals well before the close to get in to the trade earlier.

TZA Trade Example

Just as the longer term market average charts have seen a lot of damage the last few days, the longer term inverse ETFs have seen very positive signals over the a longer period.

Earlier I mentioned using a market bounce to buy in to price weakness in these ETFs.

 TZA 60 min chart with a very positive divergence, yesterday was a typical shakeout below support in yellow that we often see just before a move in the opposite direction, as I pointed out, we saw the same in the market averages today.

Here's an example on the SPY intraday...

A dip below intraday support in the SPY before it headed a bit higher in to a positive divergence, like TZA yesterday above.

Here's the 1 min TZA chart, almost the mirror opposite of the SPY 1 min above, seeing a short term 1 min negative divergence as it should being an inverse ETF.

The idea is the long term charts in inverse ETF's like TZA are showing very strong positive divergences while the market averages on the longer term charts are showing very negative divergences. A short term bounce (and I would think we would get a little more then what we saw today off the lows), should pull TZA back. As the market bounce goes negative short term, TZA and other inverse ETFs should go positive short term offering a chance to buy them at a discount from here, while the longer term positive divergences in these inverse ETFs give them support.

I'll put out a list of several that I think will be good candidates.

Thoughts on a bounce

Here's a look at the SPY intraday chart suggesting the bounce which we have seen a little of thus far.
 1 min intraday positive divergence...

This is the 15 min chart.

Basically the point is the longer term charts are far more influential to the trend and underlying trade then the short term charts. There's a lot of damage done on this 15 min chart in a short period of time.

GLD Update

 This is the GLD 5 min chart looking like it is seeing some accumulation as it pulled back.

 Here's the 10-day moving average, typical support for a first leg up pullback.

 Here's a gap area that I thought might provide some support, it looks like it is.

 And here's the 15 min chart showing the pullback and a positive divergence building here, suggesting a bounce off this area which is about in line with my original trade expectations.

The hourly chart's positive divergence is what got this trade started, from the amount of accumulation here, I suspected it would produce enough upside for a swing trade.

Bounce

If this bounce doesn't get moving soon, it will probably come on the open tomorrow.

I'll be adding some inverse ETFs to look at for short term trades as we can probably pick some up in to some accumulation on a pullback/market bounce.

IPGP Trade Idea Follow Up (short)

 Monday's long wick candle looks to be a resistance zone in IPGP, ultimately, that's the area I'd like to be starting or adding to a short position.

 It looks like IPGP has found some weak support, but probably enough to get it to move. The red arrow is a break through the top pattern's neckline.


 There's a positive divergence that should get IPGP a bit closer to the Trend Channel stop, reducing the risk on the position.

The white area is the approximate target zone for a bounce. If you like, you can email me any time to get an update on the charts, especially if you like the trade and it reaches the target zone.

ES Update

Like most of the market, ES is showing the same intraday positive divergence....


The SPY even gave a little tell.

See the little shakeout in the red box, that's pretty common on all timeframes, a small head fake before the move.

You might even consider using an Ultralong Market ETF to play the bounce, but I would not hold it through the close, I would close it out before 4 p.m.

European Close

 The EU Top 100 Index closes at the lowest level in 14 days (1 day short of 3 trading weeks).

 The 22 day moving average that I find to work well to define trends has seen the second break of the average since December.

For the first time since December, the EU 100 Index has broken below the 50-day moving average on a closing basis.

AMZN Update

Remember my earlier post about AMZN

AMZN support around $200, also the area that will need to break to get a good head fake trade, but as we come up on $200 my guess was it will bounce off that first. AMZN low of the day $200.31

AMZN getting ready to bounce off that $200 area.

It's still a nice looking trade (not quite yet), but this is the market's volatility.

Quick Update

 Earlier I posted the start of some intraday positive divergences, I can tell just by looking at price the SPX is making a little base to bounce off of.

And I can confirm it here on the 3C 1 min chart.

It's rare for the market to hold losses that early in the day without throwing in some volatility shakeouts. There may be some opportunities here to short in to some strength. Lets see how it plays out.

Risk Layout Update

Today is a good day to demonstrate the divergences between some of the risk indicators I have been showing the last few days that have been putting out red flags and the concept of reversion to the mean.

 First commodities vs the SPX (SPX green), the last 2 days commodities have diverged from the SPX, today on a near term chart you can see how the SPX has nearly reverted to commodities or to the mean.

 Longer term there's still a larger divergence warning longer term.

 Yet even longer, since the start of the rally, there's a huge dislocation between the 2 risk assets groups.


 Remember yesterday I said, "Yields are like a magnet for equities".  The last 2 days yields have been diverging from the SPX and today they have reverted to the short term mean.

 A bit longer term and there's still a large dislocation.

 Even longer term going in to 2011, look at how Yields diverged from the market, soon after a 20% plunge in the market and a reversion to the mean, however now the dislocation is much bigger.

 The $AUD as a leading indicator  has been warning the last two days and today the SPX reverts toward the short term mean.


 A bit longer term and the divergence is still wide.

 You can see how dollar strength also effected the market

As well as Yen strength which makes the carry trade more expensive.

FXP Update

I posted FXP yesterday, it's looking like it is prepping for the next leg up.

FXP up today, but still below resistance. It may pullback some today, I'd love to pick it up around the 10-day moving average, I don't know if it pulls back that much though. We'll keep an eye on it, however I think it can probably be bought a bit cheaper then where it is now if you are patient. Otherwise, you can always buy the breakout.

Market Update

 DIA 1 mi is about in line

 The 2 min is close to in line, maybe an intraday positive divergence, but the damage is being done to the longer term charts. Ironically AMZN is right near $200.

 Longer term 2 min trend

 Like I said, the damage is being done, the 15 min

 I don't even need annotations on this 30 min, look at the leading negative just so far today on a long chart like this

 IWM showing an intraday positive divergence

 The 5 min chart from leading negative to even worse leading negative

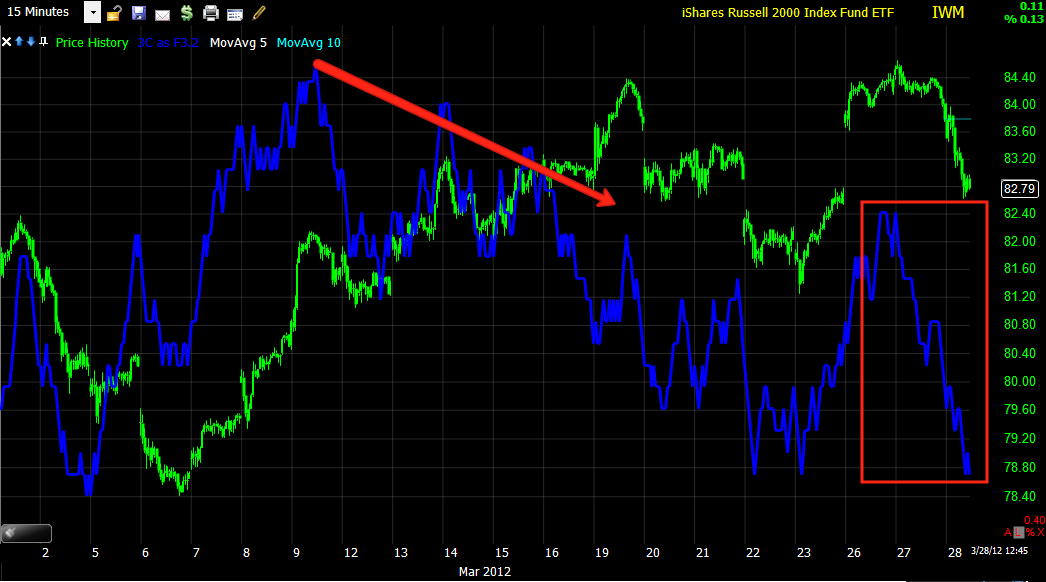
 The 15 min chart leading negative, compare to where 3C was on the 6th and where prices are.

 IWM 30 min, like I said, the damage is being done.

 QQQ 1 min possible positive intraday divergence.

 The 2 min with a positive intraday divergence

 More damage on the longer term 2 min trend

 Look how much damage was doen to the 5 min today alone/

 And the 15 min

 SPY 1 min mostly in line

 2 min showing an intraday positive divergence

 5 min seeing more damage done to an already leading negative divergence

Lots of damage to the 15 min.

There will be bounces and shakeouts as I mentioned earlier, but the longer term charts are more important and there is a lot of damage being done there.