Our original December 12th forecast was a theory at first based on a few signals and mostly Mass Psychology and largely based on the concept of head fake moves before reversals in topping patterns. The more obvious a breakout area is and the more watched the asset is, the more probable of a head fake move creating a bull or bear trap that creates among other opportunities for smart money, strong momentum on the conclusion of the trap.
The 6 week range in the IWM that had not moved more than -0.38% over the entire period was the most obvious range in one of the most widely watched assets out there, thus it was the perfect candidate for a head fake move and the probabilities in my estimation were around 95% that this would happen as opposed to the concepts more broad probabilities of about an 80% chance before a reversal either up or down depending on whether we are at a top or bottom.

After the data that backed up the theory started pouring in the very next trading day, a Crazy Ivan shakeout became part of our forecast, it's a shakeout on both sides of the range, the first creates a bear trap and provides upside momentum to do what the IWM could not do by itself for 6 weeks, break above the range. The second is another head fake move setting up the larger scenario which was our forecast since Friday December 12th, a head fake move above the range in the IWM, luring in confirmation seeking bulls who'd buy the breakout, creating demand for smart money to sell their large positions in to or short (again larger positions) in to that demand.
To date, everything has happened as we expected, even the area of the IWM breakout, which had to be at least above $118. The two yellow boxes represent each of the head fake moves taken together creating the Crazy Ivan shakeout concept.
As you can see, the IWM is now moving to fulfill our big picture forecast as the breakout above the range was only a means to an end, it was the bull trap, the head fake move that creates so many different opportunities and necessities for smart money's large positions, see my two articles "Understanding the Head-Fake Move" parts 1 and 2 which are linked at the top right side of the member's site for more information on why head fake moves exist.
Although there was a little bump up in volume crossing below the $118 level this morning, it's not the volume that hits the long's stops and draws in new shorts, it appears the actual support level may be around $117.90, although $118 seems more reasonable as a psychological magnet, look for volume to increase on any move lower in the IWM, that's the bull trap being shut.
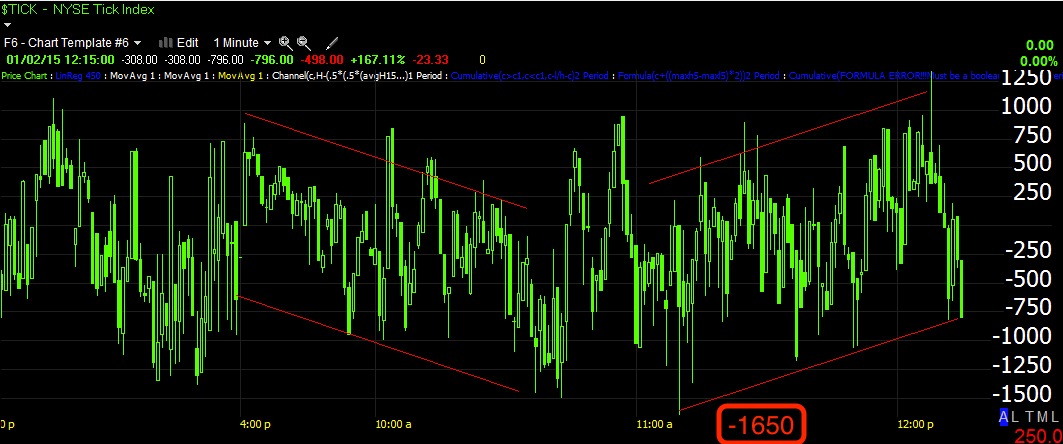
Our custom SPX: RUT Ratio indicator wasn't screaming bullish Friday, but it wasn't confirming the lower lows in the SPX, which fit with the 1-day oversold event and a corrective bounce , but this morning, whether it was bad news taken as bad news for the first time in a long time or something else, the indicator collapsed leading the market lower or at least confirming price action thus far.
Looking at the averages, they all look similar to the SPY below which is further confirmation of our forecast and the last stage of it, the move down...
SPY 1 min is not showing anything threatening to this downside move right now.
The stronger charts like 2 min are also in line with the move lower.
And the big picture charts that show the move above the range was a head fake as we confirm the breakout is showing distribution and thus will not hold- 10 min with the forecast date for this event highlighted, December 12th.
The larger picture, broader charts suggesting we'll see a new lower low below the October lows given a little time, not immediately, are also right on track.
There are some opportunities out there and overall this is still a strong area for a short entry, although I don't ever like or advocate chasing the market, I'd rather enter on a bounce (price discount, less risk and usually better timing).
I'll be bringing you some opportunities I think I think are worth a look.


