Wednesday, January 19, 2011

Market Update

Well there are stocks everywhere getting slammed today. I'd attribute a large part of it to the Portugese incident, but I'll have to do some dgging later to confirm that.

One thing is for certain, yesterday I told you the Dow was tipping it's hand and showing some negative divergences/distribution. Ironically today it's held up the best.

Here are the current charts and if you are a bull, you're not going to like them.

 The DIA's negative divergence is now spread to the 30 min chart which means the situation is more serious-but you can see that in the market's action. The last 2 days have confirmed this divergence.

 The Q's were coming out of an ascending wedge, I talked about it and knew that we'd see the typical volatility of a very familiar pattern as the black boxes love to make 100 years of technical analysis the weapon of choice they use against you. The 30 min picked up on the divergence late yesterday and is leading today.

The SPY 15 minute, which is a nice timeframe for reversals of the "Swing" magnitude, traced out this nasty little divergence which was relative until today when it went into a leading divergence.

There are some short term positives, I'm not sure what to make of them, but the market has been very "Gappy" lately so a gap in the a.m. would make sense (to the upside). We also haven't seen downside in many of the averages like today in quite awhile.  Just looking at the 1-5 minute positives, I see there's a slight bid in after hours, so it could be about that too where the market makers/specialists pick up some shares toward the close and sell them to permabulls who are stuck on the "Buy the dip" mentality no matter what the charts say.

For now, lets take it for what it is, a bad day. I'm going to check the market breadth and the P/V relationships, today could have created a one day oversold like the one day overbought I mentioned last night. As they say, one day does not make a trend. I do believe though we are setting up for some nasty downside. The bases I've seen in some of the inverse ETFs are just too big for them not to pop. If/when they do pop, it's going to be ugly with bases of that size.

I'll be reporting back, I have a lot of charts to look at.

FXI another bear flag breakdown


Here's the familiar bear flag. Note the trend lines are drawn a bit narrow, the reason why is the two days sticking out were both false breakout/breakdowns, the reason I know this is because of the quick and immediate move in the opposite direction.

On the 30 min 3C chart you can see both with divergences representing the false moves so that gives us some further confirmation

The 15 minute shows the negative bias as well as the false breakout as well. Note the position of 3C at the recent high, this gives me some confidence we are not seeing a false breakout as the distribution pattern is larger-actually throughout the bear flag, which is the very reason bear flags exist.

The 1 minute chart is in confirmation of today's move out of the flag.

This is a fairly new breakdown so it's in decent position.
Stops that can be used include $44.65 and $44.85

DELL a Short Trade

 Dell daily, a bear flag consolidation breaking down. I've had an alert set for this breakdown, it just sent a trigger.

 3C 60 minutes in nice confirmation until several days ago, a beautiful negative divergence at the top of the range.


 30 min chart confirms the same

10 min chart confirms again, this is what I like to see, multiple confirmations.

Dell may pullback a bit and offer a better entry, but you may risk it not coming back at all. You could try a phased approach adding on any strength, wait for a pullback or just go for it now, but your stop needs to take a pullback into consideration.

I'd think an initial stop at $14.20 would work. The trend channel is at $14.27 but it'll probably hit $14.20 by the close. This is another bellwether stock taking it on the chin-not good news for the market.

And they BEAT!

Here's yesterday's earnings pick-a short sale in AMR which reported earnings this morning.

Can someone email me and let me know they took this trade? Down -5.8% in a large cap.

In the Famous Words of Paul Harvey, "And the rest of the story"

Today is a POMO day, just about like every other trading day save 1 or two every couple of weeks as the Fed is busy monetizing as fast as they can before Ron Paul hauls them before the Financial Services Domestic Subcommittee in the House.

And what happens again today? The Fed monetized newly issued debt from the Treasury to the Primary Dealers. In the process the PD's are making millions of dollars. It's a simple and diabolical scheme. the Treasury issues debt, the Primary Dealers soak it up knowing full well the Federal Reserve will buy it from them because lets face it, China voiced it's displeasure with US monetary policy to Hilary Clinton and stopped buying-in steps the PDs and the Fed. Now the downright dirty part which is costing tax payers billions of dollars for literally nothing.

Today the Fed bought treasuries from the Primary Dealers that were just issued January 11th. The PD's are flipping them so fast, they literally have no risk. Each POMO puts millions of dollars in their pockets through the bid/ask spread, the Fed takes on the debt which is effectively monetized and these PD's levitate the market with their 100% risk free capital.

AAPL with it's weight on the NASDAQ 100 Index which is estimated to be around 20% of the index, or about the same as 50 other NASDAQ stocks combined, is the easiest way to lift the market. So it's always fun to watch AAPL around 11 a.m. on a POMO day.

Again, note the time-

The first positive divergence in believable as AAPL has to consolidate after taking the lumps it took this a.m. and since the 5% gain in A.H. yesterday. The second divergence is a leading divergence (stronger) and it's at what time? 11 a.m. right when POMO operations are officially concluded.

The SPY again....
Same time, same divergence. If the DIA/Dow wasn't so ugly we'd probably be going through the roof. But here's te catch, they don't need to go through the roof. Investing several hundred million dollars, they can make a nice profit on a minimal gain, or I suspect if the red phone rings, the nice profit can turn into obscene profits on top of obscene profits.

Really, this is infuriating. If the Fed is going to monetize the debt....


Despite a blatant lie under oath to Congress....

Then just let them buy it straight from the treasury and cut out these PD's that make billions for taking no risk, manipulating the market and costing tax payers billions.

They did it again

Here's the SPY-story to follow....

Two positive divergences and a leading positive divergence, take note of the time 3C went leading positive, the same time POMO ended.

I want to get this out so you know where the market is going near term, story is coming next.

Precious Metals and USO

I haven't had too many emails about SLV and less about GLD which I take as indicative that members aren't buying the viral, "Lets Squeeze JPM's Silver Short" campaign or the media's "Gold's run is like diamonds, forever".

As I've said in the past, I'm not opposed to either trade as a long, they just need to show they deserve the money invested and they haven't done that.

Take a look.

 Both GLD and SLV remain under resistance of large formations that in my opinion are too large to be consolidations, that leaves probabilities rising that they may be tops.

 Here's GLD's recent 1 min 3C chart. There was a small patch of accumulation, just about big enough for a little bounce and we saw that the next day. This morning's gap up was met with a negative divergence, not confirmation and while GLD is still up on the day, it hasn't run higher then the gap. It still could run a bit, we'll have to watch the charts unfold, but I don't see enough accumulation to make a serious play at taking out resistance thus far.

SLV-again trading under that resistance with a gap up this a.m.

 This being a 5 min. chart  it's more compressed, but the patch of accumulation (white arrow) is the same place as GLD's, again not large enough to produce much more then a bounce. And look at this a.m.'s gap up and  just how negative that divergence was-no confirmation, no leading divergences, it just looks like  gap that took some silver enthusiasts' money.

USO I've been throwing in with the PM updates so here it is. Talk about failed gaps this morning, 3C is making a new low on USO. Maybe if this continues we'll see USO make a move out of the range and I'm not thinking to the upside.

Flash Crash

Whenever there's a report of a flash crash I try to immdiately follow it up, one because they are getting more brazen and more abundant and even happening on the major averages and the second part of that is to reveal the nature of them so you know what to do if you're hit by one and chances are, when the averages got hit, you were a part of that.

Today MHR was hit, here's the charts and the nature of these have been pretty consistient.

 The first chart I'm showing you is the daily because I can't scale the intraday to get all of the crash. As you can see, the stock lost about 50% in the F.C.

This has been the consistent nature of them, 3C 1 minute which in the blue form is fast enough to follow the action (although I'd love to watch it on a tick basis) has always shown the same thing, accumulation a the bottom and the stock recovers most of what it lost pretty quickly. This is why I've said not to panic in this situation, you're likely to sell at the bottom when it seems they are just stealing shares, but their stealing them to flip, so once there's some recovery, I'd be looking for an exit. This is ANOTHER reason not to have stop or limit orders on the books, but rather keep them mental. Anyone on the books lost their shares.

There will continue to be hearings on these events , but don't expect the SEC to do anything about them anytime soon.

Market Update

Yesterday near the close I brought you this post, LAST UPDATE and last night I told you about the singular Price/Volume relationship dominance that suggested a 1-day overbought condition. It seems the DIA was tipping it's hand yesterday. Here's what the chart looks like now...

We saw a persistent negative divergence all day yesterday and the Dow traded laterally most of the day-that alone is breeding grounds for distribution. This morning's gap and the highs attempted this morning were both hit with negative divergences and that's where we stand as of now. There are divergences on the Dow now stretching out to the 60 minute chart-not a good sign. We'll see if Brian "Sack" is going to feed the Primary Dealers obscene profits on 2 week old treasuries and try to levitate the market.

It Wasn't a Dream, Just Common Sense at This Point

My late night post (a little back pain keeping me up) talked about the lack of clarity regarding what the E.U. In general is going to do about heir bailout facilities for the PIIGS countries (Portugal, Ireland, Italy, Greece and Spain). I swear I didn't know anything about the finance ministers meeting Brussels, I just woke up and looked at some charts. They said nothing and did nothing regarding expanding the bailout facility which weighed on European sentiment, which weighed on European economic equities.

When I mentioned the risk on/risk off cycle in Europe which now has a shelf life of about 3 days rather then months, I didn't know that Portugal's Prime Minister begged for help/bailout last week. Apparently he virtually begged Angela Merkel according to eyewitness accounts. It was neat that eyewitnesses were there and even better that Dominique Strauss-Kahn the head of the IMF as well as the Italian Foreign Minster who's been leading the charge for a Eurobond. Here's where it gets good. Merkel put the request on hold to consult with her visitors and Strauss-Kahn told her the request was pointless because Portugal wouldn't follow any advice given. The actual term used was, “he was dismissive”!

Now this is interesting on it's own: Portugal is now in the hot seat, the power players that can help them are dismissive, contagion fears are back, but we get an added bonus, the sentiment survey released after Jobs announced his leave of absence at AAPL appears to be a complete farce! How can those numbers come out like they did-doubling when Portugal is the next of the PIIGS to fall?

Furthermore, regarding my comments on the Euro bank 2011 theme, Ireland is said to be Junior Bond holders of Ireland's Allied Irish Bank are being told to take a deal to buy back bonds at 30% of face value or risk getting the “stick”! Bond Holder Haircuts anyone?

Back to Greece, I'll keep it short, but as the fears have been for several months, their just recirculating, there's fear that Greece can't repay it's debt which means it will have to restructure the bailout they received in May as they've broken the terms and lied at least twice since then, I doubt the restructuring will be favorable if it's offered at all.

Moving on, AAPL is down from last night's 5% after hours trade and near flat on the day.

AMR's earnings beat, the stock is down thus far on the day. Remember these earnings picks aren't beat or miss, just what happens next. Well, lets see. Other picks from last week, JPM and INTC are also down on the day and made no forward progress after earnings. We might be heading towards 3 for 3.

A Real DOG of the Cats and Dogs

But this dog may hunt. Check out BCON. It just hit $.31 which is resistance from yesterday's 7.5% gain on HEAVY volume-the heaviest volume seen in 5 1/2 years. It will also be breaking a downtrend line around $.32.

THIS IS AN EXCEPTIONALLY SPECULATIVE TRADE, MAKE SURE YOUR RISK MANAGEMENT IS SPOT ON. Otherwise, as I said, this dog may hunt.

ATEC

Keep an eye on this one above $2.86 which is the breakout level for a possible long play, still a C&D trade.

European Banks Back in the mix

I listed 4 or 5 European banks that look like good longer term short sales, with volatility being as high as it has been the stops were probably too tight for these types of trades. I think moving forward I'm going to have to adjust my Trend Channel settings to reflect risk on/risk off volatility especially as it pertains to the never ending risk on risk off cycles in Europe which are growing shorter every month.

In any case, these stocks are going to be worth a look at current valuations for at least a swing move so take a look at the January list of European stocks, I'll list them again in the morning and we'll see if there's any good swing setups as I feel it's likely we'll see at least a swing correction.

Originally these were 2011 theme stocks and really weren't meant as Swing trades, but until there's more clarity on whether the EU/ECB and specifically Germany are willing to expand facilities to deal with peripheral sovereign debt, these may need to be shorter in duration although I do think a longer term perspective may warrant a phased in position when we get overbought levels, little pieces at a time.

Furthermore, MUB here at home is going to warrant closer scrutiny as there seems to be little that can be done to bail out 47 states and hundreds of municipalities that are carrying overwhelmingly high levels of unfunded liabilities.  I believe the Fed has already stated the scope of the problem is outside their mandate, but they've increasingly taken on the role of self-appointed mandates. 2011 promises to be a year in which the sheets are pulled back on the Fed and in my opinion, the sooner the better.

Just recalling the bit in the December 14th minutes that stated the losses homeowners have accrued have been offset by the market's gains still makes me red in the face. I don't know a single person who's said the 50% losses they've suffered in their home's worth have been offset by their 401k. What a ridiculous statement to make and with that statement, the Fed's self appointed 3rd mandate has become clear. Perhaps their survey was heavily biased toward primary dealers?

BPZ-the Mechanics of the Trade

This is a long trade on the January list, it's set to Limit so here's how I see it working out to be a worthwhile trade. There are a lot of stocks getting pushed around and churned via HFT and other computer based/algo type program trading. Their character is very sterile, mechanic-like. This is an example of a trade that has a more organic feel to it, a flow that makes sense and a risk:reward ratio or setup that makes it worth a try.

Here are the charts....
 Note the red trend line depicting resistance, it's also depicting what appears to be a base. From the left, the first green arrow is the low on big volume, we can pretty safely assume this is a capitulation event or the end of stage 4 (decline) losing about 67% from January 2010 until capitulation. The next green arrow is a second dump on high volume, but price doesn't make a new low, we have something akin to a successful test of support. The last green arrow is a breakout of the base on volume.

 Here's a closer look at the breakout. There's 4 red arrows probing resistance; after the 4th we get a hammer at the first green arrow (support), the next day a breakout on rising volume. Then a few days maintaining support and another follow through upside move at the white arrow, again on volume. At this point we're at the early part of stage 2-mark up. There's a pullback from there, after all, we just saw a  30+% move in a month. The pullback is orderly, volume decreases showing sellers are not aggressive and yesterday was the lowest high/lowest low-we now have a trigger point and stop. The upper white line is the limit buy order around $5.11, the lower line is the stop around 4.91-not too bad as far as the risk profile goes. We just need that move above $5.11 to trigger a long and the probability of the resumption of the uptrend.

 Here we are looking at a daily 3C chart. Note the capitulation event, which is marked by churning, is not showing a significant new low in 3C, it's nearly a positive divergence. The next white arrow is a positive divergence/accumulation and the stock rallies from there. The red arrow shows a negative divergence around the first probe of resistance, The White square is difficult to make out, but it's before the breakout and making a new high, it's a leading positive divergence, the best sign of accumulation and then we get our breakout.

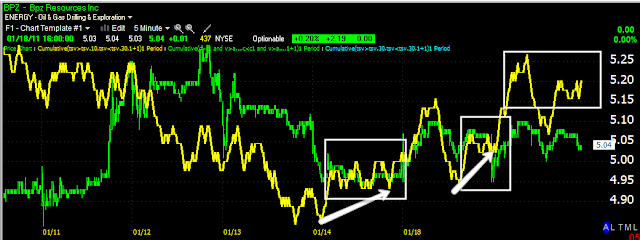
 On a 5 minute chart, 1/12 is our high and subsequent pullback. Note the positive divergences in white and the last square is another leading positive divergence.

 Using my custom screen, you can see the long signal in all 3 screens at Oct/Nov -not once since then has it given a sell signal. More importantly for our purposes, the breakout essentially starts a new phase, stage 2. After a strong breakout the first pullback is usually to the yellow 10-day price moving average, that's where we are now. A wider stop could be used below support at the red trendline, but what I like about the trade is the minimal risk in a high probability situation. I'd put 2% of portfolio risk in this trade no problem.

As for our target, the measured move is from $3.00 to approx. $4.75= $1.75+$4.75 gives us an initial target of $6.50. That's about $1.50 reward vs. $.20 risk or a R:R of 7.5 to 1 which is double my minimum R:R for a trade.

This is a specific setup and I wanted to share the mechanics of it with you. IF you have questions, please email me, I know there's a lot of different concepts stuffed in there, but this is a setup you can throw into your bag of tricks. Lets see how it plays out.