Tuesday, June 21, 2011

Finding Yourself

Back in 2006 when the spiritual craze was everywhere you looked, I wrote a piece at Trade-Guild.net called, "Zen and the Art of Investing" You'll see by some of the references, it's a bit dated, but I hope someday soon you'll take 15 minutes to read it as the conclusions are just as valid today as they were back in 2006.


I've spent years writing about the markets and sharing my experiences, I love what I do and I love to be able to help people who love the market. Friday I posted an email from a member who took my analysis of the market and what I thought the most likely close would be ($127.25) for the following day. This member created an options trade and made $1000 for the day. Another member who's been with us for several months has taken his portfolio from 40% down to regain all of the lost ground (nearly doubling his return) and is now in the green; that's amazing performance and discipline.


Today I received this email:


"Hi Brandt,

Thanks to your 3c analysis, I banked 70% on SPY calls bought from yesterday's lows to today's high. Dumped them right at the last move up before the close, it was on 10 contracts so paid for one year subscription fee and more."

This member has been with me a long time and I know his trading style pretty well. He often trades the Wednesday morning energy report when we find underlying action that is counter to the market's move. He's found a great niche in selectively using options and has had so many great trades I can't even begin to count.

The point of this is not what I did, I'm providing information and ideas, these members are applying that to their trading styles and are getting incredible results. I love to hear these success stories because I see WOWS achieving what I hoped WOWS could offer. It's not a pure stock picking service, or a newsletter, but hopefully a process and a different perspective on the markets and trading. I don't want credit for the trades and don't deserve it, I'm giving you the information you pay for each month. You guys are the ones making and managing the trades. I want that last sentence to be clear-YOUR SUCCESS IS OF YOUR OWN MAKING! It's important that you realize that.

I feel you are most successful as a trader when you have found your niche, what works for you; that's why I offer so many different ideas, we have so many unique traders. 

If you haven't found that snug fit yet, it's okay, it's a process and as the article mentions, a sort of spiritual journey. Risk management can keep you afloat long enough to find yourself when it comes to the markets. A trading journal is absolutely indispensable for finding what works for you and what doesn't. There's no one size fits all and the process of finding what works for you is a never ending series of adjustments, discoveries and lessons.

The message I really wanted to get across is, find yourself (in the markets) and success will find you.  

I'm really proud of the wolf pack, I've watched so many of you grow and I believe in you all. Just make sure when you send me your emails of success stories, you remember that the trade was of your own making and be sure to give yourself the credit you are due.

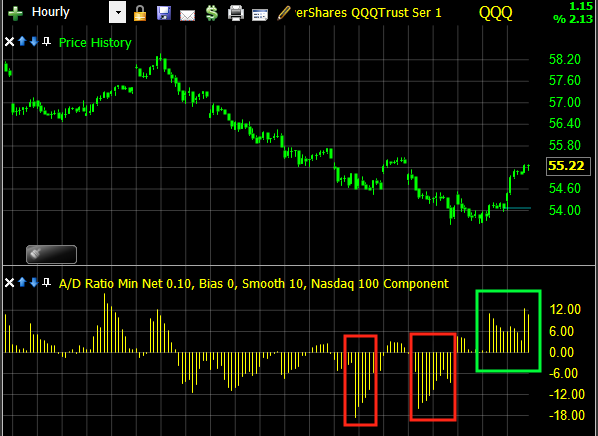
Now, quickly on to the markets, Japan and the Asian markets like what they see in the Greek vote. Dow futures were up about 16 points at last check, although a lot can happen in the next 10 hours. I still feel there's enough accumulation to carry this bounce higher, ultimately I'm looking for the daily 50-day moving average, and then I think the next plunge could be one of the worst we have seen in several years. One bridge at a time though.

I'll see you in a few hours-and congratulations S.Y.!


Today's Market Internals

I think the thing that stands out the most is the number of gainers. For +5% gainers and -5% losers, the number was quite strong with 303 5+% gainers including our NUGT position today. The -5% losers came in at 47 (and likely many of those were leveraged inverse ETFs).

There was no dominant price volume relationship, but for all NYSE stocks, gainers came in at 5523 and decliners at 1190 a 4.6 : 1 ratio.

For the Dow 27 advances, 2 declines and 1 unchanged.
The NASDAQ 100 saw 93 advancers and and only 7 decliners!
The S&P-500 448 gainers vs 51 decliners and 1 unchanged-a nearly 9:1 ratio which is a better measure of the market considering the NYSE composite includes inverse ETFs whereas the S&P-500 does not.
The Russell 2000 came in with 1671 gainers vs 181 decliners.

As for the charts...

Breadth

 The hourly NASDAQ 100 Advance / Decline Ratio spiked 2x last week, we also had two days of dominant price volume relationships that suggested a short term bottom by way of capitulation. Today's A/D line looks good as you'd expect from the internals I mentioned above.

 The % of stocks moving above their 60 min 50 bar moving average is also quite strong, with 80% now above the hourly 50-bar average.

It is important though to keep the big picture in mind, and this daily chart of breadth for the NASDAQ 100 shows you were things went badly wrong at the new highs in May.

As for today's trade...

 This is the SPY 10 min Bollinger Bands. It's extremely bullish when an average walks the upper band as we saw here until about 11 a.m. as we approached a resistance level. The longer the chart time frame, the more important this behavior of walking the bands is. Conversely walking the lower band is extremely bearish for an index. I think this chart simply points out the importance of today's resistance zone.

 This chart shows volume by price and once again, you can see sell-side volume had a much higher ratio to buy side volume around the resistance level.

Finally, as you saw all day with 3C, TSV 55 on a 5 min chart shows the same action 3C was showing and once again the resistance level and the subsequent test of that level saw distribution.

As to tonight's major event, the Greek confidence vote...

Panpandreou won the vote at 155 to 145, a pretty much straight party vote as his party controlled (I believe) 153 seats after two defections.

The Euro's reaction thus far (which I think we should consider to be knee-jerk) has been to sell the Euro sending the $USD higher. It's not yet a bloodbath or anything like that, more of a sell the news event. However, if this keeps up overnight, the dollar should strengthen and the inverse correlations like equities, could see some downside selling pressure, which would be roughly in line of a pullback that seems to be in order before the average try to move through today's resistance.

Here's' the EUR/USD pair as of 6:30

The Green arrow is where FX opened the week and the red box is the reaction to the vote.

In after hours trade, the market is down marginally, silver is up marginally and GLD is just a bit above unchanged.

I don't like reading too much into knee jerk reactions and will check the FX pairs in a few hours to see what sentiment is looking like.

I'm sure I'll most likely have a follow up post tonight, watching for any obvious changes in sentiment.

Miners Trading System Signal

This is one of those times when a trading system can't consider all the variables and there's an element of discretion.

System 1 which went long NUGT today actually moved out of the trade at the close. Considering NUGT posted a 5.17% gain (if bought on the open) you may want to keep the position open. The system's standard stop-loss is 3% below today's open @ $26.81.

The reason I mention this is 1) the signal to buy NUGT and subsequently today to sell NUGT tomorrow morning is the first system that has more false signals. 2) System 2 which has less false signals has moved closer today to triggering a long in NUGT as you'll see below.

System 2 is the blue line and a crossover above the red line is the signal to buy NUGT. Last night system 2 was close to a crossover, tonight it's even closer (last night's position is at the red arrow).

This is the age old dilemma of automated signals, whether to take the signals as the system offers them or can you get better performance by intervening when you feel there may be a good reason to do so.

As far as 3C, NUGT looks pretty good, there's a slight 5 min negative divergence suggesting a possible pullback a bit, but nowhere near what the market has been showing.

So I leave it to you.

The official system signals are:
System 1: Close NUGT in the a.m. and re-open DUST long on the open.
System 2: Continues to be long DUST (although it's very close to a NUGT long signal).

Feel free to contact me with any questions you may have.  (BT46N2 @ Gmail.com)

Silver looks like it's going to give back some

We talked about this earlier, here's an updated set of charts for SLV

 SLV 1 min in a leading negative divergence toward the close

The 5 min chart is in a negative divergence.

Look for SLV to give some back. This may be Euro/Greece related via the typical inverse relationship with the dollar.

Pullback Target

The 5 min charts are suggesting a pullback as I've felt for a good portion of the day. The test of the day's highs failed, but not before posting a marginally higher high, which is very typical as most of you know before any reversal. It's looking like tomorrow we will likely see a pullback and hopefully  a strong consolidation.

Here are my initial thoughts on targets for a pullback.

 DIA 15 min chart with a 50-bar moving average

 QQQ with the same as above

SPY, same chart as the two above.

USO-UCO

Going in to tomorrow with a small position in UCO (leveraged long Crude ETF) based on the charts below.

 USO 30 min positive / leading divergence

 USO 15 min positive/leading divergence

USO 5 min positive/leading divergence

Miners Trading System

So far so good, if you took system 1's signal from last night you should have about a 5% gain in NUGT today thus far. I feel pretty confident system 2 will give a signal to go long NUGT tonight.

In either case, as I explained last night, both systems are outperforming 99% of the hedge funds out there so if you didn't take last night's signal, I don't think you are missing out on too much. System 2 actually performs better then system 1 and these trades tend to last a couple of weeks so if we get a signal on system 2 tonight and you didn't already enter NUGT, it's likely this is just the start of the move.

I like the fact that volume increased today on NUGT.

Move into resistance

The market is now moving into that resistance zone again...

 60 min chart-resistance zone in red

And here's the 1 min action in the SPY in the area. I still feel like the market is going to have to pullback a bit and build a stronger positive divergence.

I've taken some profits out of leveraged long market ETFs for the time being.

Market Update

The averages are pushing into resistance again, but as I said in the last update, I just don't feel like they've consolidated enough to make a push through resistance successfully.

Here are some of the 5 min charts which seem to indicate that this most recent push is likely to fail. The market's don't go straight up or down, so a pullback doesn't mean that the chance for a decent bounce is over, sometime it's just what the market needs.


 DIA 5 min 3C

 IWM 5 min 3C

 QQQ 5 min 3C

SPY 5 min 3C

USO Update

It looks like USO is overcoming resistance.

 3C continued its positive divergence, note that USO made an attempt at resistance, failed, fell back and regrouped on another positive divergence and pushed through on some volume as seen below. I'd probably use a trailing stop such as the uptrend line drawn in.


If you bought UCO at the time of the last update, you'd have a 2% gain on the trade in a few hours thus far.

Market Update-Resistance

 All of the averages are bumping up against a resistance level, shorts aren't going to cover until these resistance areas are broken.

 Some slight improvement in the DIA, this could simply be intraday movement and the averages may need to pullback/consolidate more before attempting to break resistance.

 QQQ resistance

 Again some slight improvement, but nothing really ground breaking at this point.

 SPY resistance

And some more improvement.

If those resistance levels can be taken out, shorts will feel the squeeze and start to cover, which would push the averages higher.

I'm not convinced that the pullback was enough to push through resistance, the market may need to consolidate a bit more.

SWK Trade Idea (Short)

You've probably heard the saying, a rising tide lifts all boats, that means even the horrible looking stocks.

SWK is one on my watchlist that is getting a little bounce (I want to short in to strength), but it's also not performing very well on the bounce.

 This is the big picture in SWK-it's topped, broke the top and is bouncing toward resistance

 Here's a closer daily chart. The volume on the bounce is very light and diminishing. Today's range couldn't hold higher prices and has fallen close to the opening price.

 A 15 min chart shows the break of support (break of the top), some accumulation for a bounce and the current bounce underway. I would not enter a full position without the 15 min chart going negative, but for traders with longer term perspectives that like to phase in to trades as Wall Street does, SWK is a pretty decent looking stock to do that with. One of the advantages of this approach is leaving room to add to the trade if we get higher prices, but also having some short exposure should the market just break down on some unexpected news and we've been getting a lot of that with Greece lately.

 The 5 min chart shows higher prices today didn't stand a chance as 3C would not confirm them, sending SWK lower intraday.

The yellow area is gap resistance, which tends to be some of the strongest resistance. SWK has failed at this area 2x now. If it can rise with a market bounce, I don't see it going much past the white 50-day average around $72, which could be lower by the time it were to reach the area.

If you like the idea of this type of portfolio set up, then I would consider a partial position with risk management allowing for a move to 472 or so, where you can add the rest of the position. If SWK just breaks down, you can add the rest then too, it has plenty of room to fall.

FTWR C&D Trade Idea (long)

I was just looking through some charts while StockFinder is running a scan and came across a C&D (Cats & Dogs) trade-FTWR.

These trades are speculative, they aren't for everyone and I personally reduce risk to 1% on these (cut risk in half), but they can move quite quickly for some nice gains.

 Notice the big change in volume as the downtrend ended. The last run in May was good for 131% in 3 days.

 The 60 min chart reveals the accumulation before the last run and a positive divergence now in to a small , tight, triangle consolidation.

 The 30 min chart showing the same, plus the negative divergence sending FTWR lower on the last run up.

 Here's a closer look at the triangle consolidation of the last 3-4 days with a positive 15 min. divergence.

 You could always set an alert for a breakout around the $1.14-$1.15 level and let the stock prove something to you before entering.

The Trend Channel held the last move down for a 75% return, its current stop is at $.96 which may be too much risk for some of you. You can always wait for a breakout and put a stop near the breakout level to reduce risk. The Yellow ADX indicator also gave an early heads up that the downtrend was ending when t crossed down from levels above 40.

If you like these quick C&D trades (I personally prefer to take profits on any double digit gain), then you might want to set a price alert on this one. This is a SPECULATIVE trade.

USO Update

In this morning's USO update, 3C 1 min suggested there would be a retracement in USO, but the longer term charts are looking pretty good, although the accumulation period was short, but rather intense. This may lead to a bigger move, but for now I'm considering it a gift into tomorrow's inventories report in the a.m.

USO has puled back and USO itself is not yet giving a positive divergence or buy signal on the pullback yet, however, SCO,UCO are showing some interesting signals that may be advance indications.

 USO 1 min-no signal yet

 UCO-leveraged long on crude is in a positive 1 min divergence

SCO leveraged short on crude is in a 1 min negative divergence.

For those considering the trade, you have a pretty decent stop close by, around $36.45 in USO.

Market Update

The 1 min negative divergences persist in the DIA, SPY, QQQ and IWM as well as FAS.

The TICK chart is starting to show some changes that may lead to the intraday volatility or pullback/consolidation that the 1 min 3C charts have been suggesting.


You can see the trend in TICK just recently saw it's first downside break. However as to the broader market strength, it should be noted how positive TICK has been today in the +1250 region quite often.

SLV Update

As complicated as gold has been, Silver has been even tougher on the charts.

Not everything you see on a 3C chart means something, it's when there's a trend, there's confirmation of timeframes and between multiple equities that you get your best signals, silver has lacked all of that.

 One thing I wanted to point out on this daily chart is the role of volume analysis which is quickly becoming a lost art with everyone introducing some new technical indicator in every new book or magazine article. Price and volume are key. SLV shows what volume should look like in an uptrend, it should expand as it does. In a consolidation, it should diminish as it does here. The consolidation is tightening and volatility is getting very narrow suggesting a highly directional move in silver coming soon. You can't always trust the first move and we'll cross that bridge when we get there. Overall, this is a bearish pattern on the daily.


 Looking at PSLV 15 min, you can see a cycle ending and a new one starting, but there was limited accumulation on the current cycle, although the divergence stretches over a week or so, the actual accumulation looks to have only taken place around 6-13 to 6-14. Right now PSLV is in line with price and trading slightly positive on 3C.

 SLV 15 min looks the same, although it has a bit stronger of a current leading divergence.

 The problem is the lack of confirmation, like the negative divergence on this 10 min. chart.

 Or on this 5 min chart.

 The daily chart of PSLV shows 3C moving down while price has moved up the last week or so, albeit a minor advance.

SLV shows the same thing.

In the scheme of 3C timeframes, the daily trumps the intraday charts unless there is a lot of confirmation in the intraday charts. This is why I haven't been a fan  of trading either silver or gold. We want high probabilities, not best guesses and right now, this is a best guess trade.