Wednesday, May 18, 2011

Trade Management

Risk management is a concept that is crucial to your success in the markets. Some of the best traders in the world have destroyed their funds for not respecting risk. If you haven't heard about 32 year old Brian Hunter and his stint at Amaranth Advisors, this is a story that you must look into some day soon. The 32 year old hot shot trader in natural gas failed to understand and respect risk. In the postmortem analysis, it seems not only did Hunter not understand and respect risk, but the firms risk management oversight failed badly. In the end, Hunter took a $9 billion dollar fund and reduced its assets to $4.5 billion dollars in one week!

Another aspect of the story was trade management and not understanding when to take profits off the table, or in this case perhaps more appropriately, when to reduce risk.

Finding a good trade is a precious moment for a trader; not falling in love with it and understanding that the markets are dynamic and will abruptly change from your best friend to your worst enemy in minutes is another essential ingredient to your long term success. While we all have to learn lessons the hard way sometimes, a little research into Amaranth may help you set up trade management strategies that serve you well. It's always better to learn from someone else's mistakes then your own.

Below is our trade management in silver and oil today. It's not a spectacular story, but I think revisiting today's actions may be beneficial, if for no other reason then to get you thinking about the subject.

 I created this trend channel years ago when reading about the Turtle Traders. Although initially I had a totally different reason for creating it, I've found that it has served me well in ways I didn't initially intend.  Briefly for those of you using my Trend Channel, it's important to understand what it is, it's not like envelope channels or many others available in commercial charting packages. Those channels are usually static, you set up a period and the channel stays within that period. My channel is different in that it looks at a stock's recent 10 bar volatility. What this does is establishes a baseline for how that particular stock behaves. The channel is then widened by 2 standard deviations, so in a long position, when a break of the highest point of the lower channel occurs, you know that something out of the ordinary has happened and changes in character are important to keep track of. We started the morning with a 10 minute channel in SLV like what you see above, it locked in gains and was appropriate for where SLV was. However, it wasn't wide enough to accommodate a pullback, which wasn't an issue earlier today, but was going to be an issue later.

 At 2 pm today, I posted an update and widened the channel to deal with a potential pullback. Gains were still locked in, but now we could deal with an intraday pullback. The original earlier channel would have been stopped out.  This was just my personal opinion on the stop. Shorter term traders who feel that the move wouldn't last may have stuck with the tighter channel in which case they would have been stopped out today close to the top of today's range.

 USO as you can see was showing a negative divergence indicating on this 1 min chart that a pullback was likely. Toward the close 3C turned more positive, so hopefully we'll see more upside tomorrow.

 The original early 15 min channel was appropriate this morning, we wanted to lock in gains and watch how the trade progressed. With the negative divergence it became clear that a pullback would occur and at 2 pm I widened this channel as well.

 I suggested either the above 30 min version which continued to lock in gains as USO moved higher and also allowed for a pullback, but preferred the longer 60 min channel below.

Here you can see gains were locked in, but the pullback didn't threaten the position.

The goal is to get to a daily channel, we need another day or so of upward trending price to get there.

PCLN is another example, last night because of market conditions, I tightened the stop from a daily channel to a 1 hour channel to preserve profits in the short position, which can be reestablished at higher levels.

The trade was taken out around $508 today, preserving about 10 points of profit in the trade.

Usually we don't have to do some much work in trade management, but the recent choppy environment requires that we adjust to market conditions.
 In white trending markets are much easier to manage. The volatility associated with tops makes it a bit more challenging.
 Recent chop has made it difficult for bulls and bears alike to hold trades for more then a few days.

The good news is we should see stage 4 (decline) soon which is similar to the tending characteristics of  stage 2 mark up in the white boxes.

Remember, it's easier to keep money then to make it back.

As to QE3

And QE3 is exactly what the bulls NEED to see equities rise. Plot out when QE started, when QE1 ended, when Bernanke gave the QE2 Jackson Hole speech and you will see the markets moved up on QE1, when it ended and there was uncertainty about QE2, the market slid about 16%, after the Jackson Hole speech and the likelihood of QE2, the market began to rise again. Since QE 2 is slated to end in a few months (and by the tone of the minutes, looks unlikely we'll see QE 3) the market has done essentially nothing-from top to top, a 1.4% change over about 2.5 months which means everything is being unwound. And for those in the bull camp hanging on to that 4 letter word, "HOPE", take a look at this from an outlet that has had the time to review the minutes...

STORY HERE

If you don't have time to read it, I'll summarize, "Fed says most on FOMC said QE3 unlikely without big change in outlook"

FED Minutes

I've been trying to get to this, and finally here we are.

Here's the initial reaction which is pretty similar all the way around. However remember that initial knee jerk reactions to FOMC related events are often wrong, although I think it's too early to say we've seen the initial reaction.

 The market reaction via the SPY-the volume is probably the most notable reaction thus far.

 The Q's which are more sensitive to anything rate related

 The commodity index, again volume being notable.

 Silver-there's part of our correction.

 Financials , a bit muted.

And the long bond (20+ year)

The highlights:

Once again "transitory" is the Fed's favorite adjective lately, this time applied to the weakness in Q1 economic activity. The usual culprits-weather, and "transitory" inflation among commodities.
This is the Dow Jones Commodity Index, a 2 year uptrend and a 70% increase in commodities as a whole, hardly seems transitory and matches up perfectly with the start of Fed monetary policy and Quantitative Easing. While joblessness remains stubbornly high, I think it's safe to say that Bernanke's actions haven't had the intended consequences, at least not the ones we were sold. Of course there is always a bias favoring Wall Street. I don't want to get on a rant here, but billions in risk free POMO cash to the banks as well as nearly free money, it makes perfect sense to see a trend like this.

While making it sound insignificant, they raised their expectations for core consumer inflation. Again, their view is that this inflation is "transitory" which is not much comfort to the 9-10% unemployed and the 20% underemployed.

"A few members" basically thought QE was a bomb, but given it's slated end, saw no reason to change course.

The Fed (according to the minutes) seems to be looking for the exit with regard to monetization of debt (treasuries)-still judging by indirect bidders aversion to US debt and the breach of the debt ceiling, with no serious plans to address spending on Capital Hill or to deal with the breach of the debt ceiling-which the Treasury has dealt with by raiding government pension funds, it seems unlikely that indirect bidders are going to suddenly come up with a change of heart and confidence in US debt.

And to deal with this, it seems Kocherlakota's two statements within a week which essentially talked about raising the Fed Funds rate by 50 basis points in one shot, seems to be the alternative the Fed is looking to pursue to generate indirect bidder interest in US debt. There's a catch 22 there though. If we can't put out a solid plan to reduce the budget deficit and have acted so irresponsibly as to allow the debt ceiling to be breached, as an indirect bidder ( foreign central bank), I would think there's a credibility problem there. How do we pay increased interest on debts when we can't even get the budget deficit under control. All in all, this doesn't sound like the Fed is in a very good position.

Furthermore, they are looking normalize the balance sheet. This means (and nearly all participants agreed) that they will need to stop re-investing principal payments on agency securities, then or at the same time, stop reinvesting principal payments on treasury securities. And the kicker, that this should be done in as little as 1-2 years. For those looking for QE3 to lift the market higher, it seems this environment and thinking in the Fed makes that very unlikely. So it would seem that we will see the continued sale of risk assets among just about every class of investments, but specifically for our purposes, an unwind in the stock market as well as in commodities.

So all of this has done exactly what? Created the wealth effect? I suppose so if you are a Wall Street investment bank.

Well played Bernanke! Since 2 p.m. today,  Dow 5,000 looks more and more plausible.

Chart Request-LEI

We looked at LEI last Friday as a spec. trade

 Today we have a nearly 6% move and it appears volume is on track to rise today, even small changes in volume are important. I'd actually say the small changes are more important then the big volume spikes people often run scans for.

 Another trading range similar to silver and oil with positive divergences on the hourly chart at every low-just like silver and USO.

 The 30 min chart confirms the positive divergences near the lows

 As does the 15 min chart

 Here's the 10 min chart with a positive divergence kicking off today's move up which is now consolidating.

This triangle is a common consolidation/continuation pattern. However these are often run to hit stops before they move higher so I'm using a trend channel wide enough to hopefully accommodate any fishing expeditions to run stops. The hammer that has formed does look bullish. All in all, I think the trade has potential. Just be aware of the common Wall Street shakeouts that we see in these common price patterns.

SPY Update

 A bearish ascending wedge and the very typical false shakeout with a pop above the apex (technical traders expect it to just breakdown, which I believe it will pullback, but as usual they shake out some early shorts with the move above the apex).

 The 1 min chart still negative

 And now the 5 min chart is negative, with distribution into the wedge breakout, perfectly played and pretty typical.

 The 15 min chart suggests that while we'll likely see a pullback, we should see more upside.

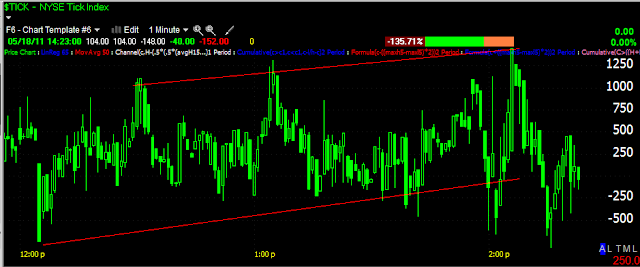
Here's the tick chart breaking the uptrend so the correction should be momentarily.

The $USD

While the $USD is down today, which is good for commodities generally speaking as well as equities, it's not down so much that I believe it's the catalyst behind the price moves we are seeing, especially in commodities. However there are a few signs we should be aware of.

 The UUP is down less then a 3rd of a percent.

 The 60 min chart though has a decently large negative divergence, which leads me to believe we will see the upside shakeout in the market, whether it comes before OP-EX or not, I can't say, but ultimately it's what I've been looking for and will work to our advantage. This is also why I feel it's prudent to widen the stops on silver and USO to allow for consolidations t take advantage of what looks to be a bigger uptrend in the two.

The 10 min chart has a positive divergence, once again, this is another reason I believe we'll see a consolidation in silver and USO shortly and we don't want to get stopped out of those longs on a simple consolidation. We entered the trade at an excellent price point, with low risk and now have two trades that even if they are stopped out, will show a profit. In addition, we have the probability of a larger move in the two. It's all about managing the trade at this point.

USO / SLV updated stops

We are getting a really nice move today in commodities across the board.

This is the CRBQ Global Commodity Index

However, the real movers today seem to be Silver and Oil/USO so it's time to look at those stops.

 SLV I widened the channel out to 60 minutes, which still gives you a profitable trade, but allows room for the inevitable consolidation that we should see on an intraday basis, this hopefully will allow you to catch another leg up. For other silver ETFs just email me for the particular stop (BT46N2@Gmail.com)

 USO on a 30 min chart should allow for a correction,

However the wider 60 minute would be my choice presently, it will still take you out if all goes wrong at a decent profit.

SPY Update

It looks like a pullback is coming...
 A negative divergence on the 1 min chart all morning...

 On the 10 min BB screen there was good momentum in the red box as price walked the upper Bollinger band, which is bullish, especially when an index does it and more so on a daily chart. It would seem a pullback at least to the median should materialize soon.

The other thing a bit bothersome is how thing the trading range has grown or shrunk rather along with declining volume. This scenario is like venturing further and further out onto a narrowing ledge.

Chinese Fraud Equities

I suppose this trend in Chinese fraud companies is similar to a lot of the Internet Bubble stocks that popped up and fetched obscene multiples because they had a ".com" affixed to their corporate name, it didn't matter if you couldn't figure out what their business model was because there often was none, they were simply fraud companies.

I've pointed out several of these companies in the past and have warned to be careful investing in Chinese stocks, but until yesterday, I didn't realize how lucrative shorting them has been. So, "Run a Scan for Chinese Stocks" is on my to do list. Luckily today one was just handed over, YONG International.

 While the channel may be volatile and wide, it's still tracking a 6 month downtrend perfectly.

3C shows nothing even remotely positive about this company's recent past, NOTHNG!

So this was an easy one, I'll be looking for more. The stop can be tightened up a bit
I wouldn't go much tighter then this 50 day moving average in case of a short squeeze and while the stop is a fairly wide 20%, the potential for this stock s possibly close to ZERO when/if the fraud is exposed.

Treasuries Continued

Last night I showed you a bunch of 20 year treasury ETFs that have been trending well coming out of two major bullish price patterns, the first a bullish descending wedge, the second (and this has been very common behavior coming out of a wedge for the last year) a base that followed the wedge. The base was an inverted H&S bottom and lasted most of this year. 


I ended the post last night with the following, " I suspect a pullback is coming in the next few days." which was a direct reference to my belief that the stock market would move higher and the very tight inverse correlation between the bullish bond ETFs and the market.
As you can see here with the SPY in red-just click on the chart to enlarge it if you are having trouble seeing the SPY in red.


This looks like it may turn into a decent opportunity to pick up TMF which would probably have pretty close to 40% projected upside.


You'll know when to take a look at TMF, when the broader market turns back down.


Back In The Triangle Again!!

Like the Areosmith song, "Back in the saddle again".. which is an ironic personal story. Many years ago I was in a rock band with Otis Redding's nephew. We went pretty far, played LollaPalooza, and all over the US opening for headline acts. However, the Aerosmith connection was in the fact that Tommy Mattola who was the head of Sony Records, set us up with one of two of AeroSmiths songwriters, Richie Supa. At the same time, Jermaine Dupree was producing our recordings-talk about an eclectic mix and at the same Studio Aerosmith recorded in.  Some interesting tidbits you probably didn't know about me. Maybe I'll post a picture one day, or maybe not.

In any case, as I've suspected, the SPY is back in the triangle which now raises the possibilities of that false upside breakout, but even if we don't get the upside breakout of the triangle, the very fact the SPY broke the triangle and is now back inside has most likely created a lot of frustration for shorts and will most likely soon cause frustration for longs buying this move.

 The daily chart.

 The 1 min chart, with a slight negative divergence, we could see some dipping above and below the trendline in a pullback scenario, but if it materializes, it should be short lived.

Here's the 5 min positive divergence, the most recent one looking better then the first by way of lower prices now and a significantly higher 3C divergence. So far the plan is coming together.

Silver and USO

It appears thus far that buying near the bottom of the range yesterday was a pretty good idea. Its not just because both have made decent moves from there (nearly 7% gain in PSLV from the lower end of the range), but more importantly, whether the trade worked or not, there was an edge there in 3C and buying at the bottom of the range made good sense from a risk perspective.

It's time to start managing the trades. At this point we know there's accumulation, we don't know if this was the last pass at the lower trend line (do we break out of the range from here or is there more work to be done?). I would reccomend running trailing stops behind both trades. This is op-ex week and trade for the last few months has ben very choppy any way, making it difficult to hold any position, long or short, for more then a few days. However, the market is what it is, we adapt or we whine about our losses and how the market action stinks. I'd rather take a profit, even if it's less then what I'd hope for.

Here are some stop losses that I would consider, your own risk tolerance and view of these trades should dictate the room you are willing to give these trades. I'm simply basing them on the merits of their individual volatility while trying to maintain a profitable position, even if it is shortly stopped out.

 SLV 10 min trend channel will keep you at a profit, I'd like to widen this as soon as possible to accommodate for intraday consolidations.

 USO 10 min Trend Channel will preserve gains and move up locking in gains rather quickly, although a wider stop will allow for consolidations.

 The 15 min TC has worked well with USO moves of 2-3 days, although if we get a breakout, the stop will need to be widened to accommodate for consolidations.

For now a 10 bar moving average on a 15 min chart is roughly the same as the tighter stop in USO.

If you are in any of the other silver ETFs or want to discuss stops specific to your circumstances, just email me.