Wednesday, March 26, 2014

FXP- Favorite Position Today

There are a number of positions doing well today, XLF April puts are up nearly 31%, GS April Puts are up +11% and while I considered taking gains on them, the signals weren't screaming to me so I think I'll have to be Jonny on the spot tomorrow morning if we get the opposite of the last 4 days and get a gap down that is faded back up, I'll want to take gains on those fast.

The SRTY position (long equity) was closed today in the trading portfolio to make some room for new positions and because of the momentum there for a 12+% gain.

I saw some things in GLD and UGLD (even though I'm packed there, I thought I'd mention them for you at some point, they had some nice looking charts, but didn't quite get to where I wanted to see them for a new or add-to position, but I think those need to be on the radar. GDX didn't look as good as some of the GLD signals, but I think it will be fine.

Most importantly there was progress in VXX.

As far as my favorite position today, it's FXP which I've been waiting for all year, a way to play China short. We've been tracking it and with the recent talk this week about possible PBoC stimulus which the PBoC already said, "Don't expect any", it seems to have been a perfect opportunity not only for the pullback/entry, but a break of the trendline which triggers stops, creates accumulation of the supply from those stops so the entry there looked to be right on cue.

Here are the charts for FXP which is one of the few actionable assets today, the others will get there, but today wasn't the day, tomorrow morning may be hectic with existing positions like the XLF puts, they may need to be closed quickly right after the open, the rest of the afternoon looked like more stop runs, but I'll update and take a closer look in a bit.

As for FXP, China 25 Short...
 You can see why we had trouble finding an entry in FXP on a pullback this year, but the break of the trendline was a great area, I don't know if we fill the gap and maybe head even lower, even if we do this is still very tradable, we'll see how we look when we are in the area.

The daily candlestick looks good for being right under support of the trendline.

We also have a rounding/reversal process as seen on the 60 min chart for FXP, that means we should have accumulation of the pullback, the kind of pullback we want to buy.

The 60 min shows the negative as the PBoC rumors started floating and the recent positive 60 min in white.

The 15 min is flying and looks great for at least a swing trade.

The 10 min

A beautiful 5 min and as far as timing, the intraday charts looked great.

1 min.

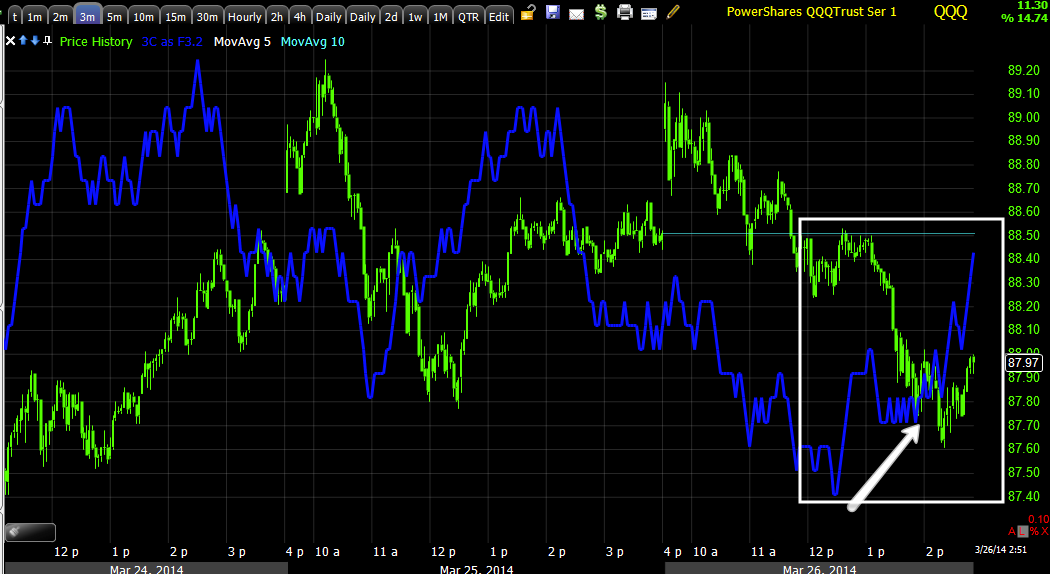
So among a lot of noise today and some rotation out of IWM and toward QQQ which looked horrible as early as today, now looks a lot better, but today, this was the best looking of the positions and I just hope that this can do more than just swing, but hold a trend.


Stops Being Hit

It looks a lot like stops are just being hit in some obvious places.

I was VERY, VERY close to some April 4th QQQ calls, I decided to wait on tomorrow and decide then as it seems stops are still being hit.

However I'd think some interesting positions for short term options (weeklies mostly) will likely open up tomorrow, in the mean time if it isn't screaming, "Buy or short me", then I'm content to just letting the market do it's thing, have it's "seeming " fits and take out the stops, trap some bears, etc.

Again, patience.

VXX making progress

You saw VIX futures earlier and I'll remind you that I have been patiently waiting for 3-4 weeks now to call out a long in VXX, it's just that I know what the signals should look like and part, a big part of why I think there have been some positive divergences in intraday timeframes in the market this week is to pressure VXX down to an area where accumulation can put in the type of divergences I'm looking for.

Today added to timeframes that need it so that's good, but intraday it looks like VXX will come down a bit which is good  for our purposes and the market will likely build a bit from here.

*Remember VXX trades opposite the market.

 The 5 min already looks good, not where it could be, but for any other asset it would be great, it was the 1-3 min charts that needed work.

This 3 min has added to its divegrence today, this is what we need for a meaningful change/pivot to the downside in the market, not for a 1 or 2% correction but for a new leg lower for the year and then some.

Of course smart money isn't going to chase VXX trying to accumulate higher prices lest they drive it up against their position so it needs to come down.

The intraday 1 min above and 2 min below show that process seeming to take hold as the Q's improve, thus we have confirmation.

VXX is not a buy yet, the market isn't where I'd enter a lot of large core shorts yet (for this cycle), but we are now seeing progress.

Closing SRTY (3x short IWM) Trading Position

The Q's are improving, it's as if they needed this downside move to get it together, the IWM is not where I would want it to buy URTY 93x long IWM) or the call position yet, but I'll be glad to take the SRTY gains off the table based on the QQQ improvement alone, ironic that it was the poor QQQ readings that kept me from entering any long positions earlier and now they are the reason I may very well open some as I at least close SRTY for now in the trading tracking portfolio.
SRTY and about a +12% gain in the trading portfolio.


Look at the Q's intraday improve...

QQQ 2 min leading now as 3C held up well vs the price decline.

The troublesome 3 min chart earlier is now looking interesting.

Even out to 5 mins we have a relative positive, that's quite a change in a short period.

As for the IWM...

The 1 min is making some head way, but this likely needs a little more sideways/reversal process and sharper positive divegrences, then it may make for a good call / add to position and / or a URTY long (3x long IWM) or UWM 2x long IWM.

 The 2 min held up pretty well so it seems there wasn't as much distribution as price would suggest which means it was likely an accumulation move on the decline.

Until this 3 min chart is screaming buy, I'm going to hold on doing anything here, just be patient and wait for the probabilities to stack up until it has the kind of divegrences I don't walk away from

MCP Update

Yesterday I mentioned MCP, specifically to a member who was looking at it and said, that's a triangle, you know what it's missing? His reply, "Yeah".

That's part of our concepts of Wall St. using TA against traders, MCP with such an obvious triangle was missing a head fake move, right at the apex of a triangle, it's almost guaranteed and the member knew that without having to think about it, that's what we got today.

Now lets take a look and see if you can spot what is missing before MCP offers a nice long entry...
 This was what MCP's daily chart looked/looks like, the head fake move would almost certainly be there, today's move below the triangle will likely turn out to be a head fake move, but just like earlier today when I didn't enter the IWM calls on the break of $116.19 because I didn't have confirmation yet, we need confirmation no matter how likely if we are really going to have probabilities lined up on out side.

 If you look at MCP's 15 min chart, what's missing now?

If you said a reversal process you are 100% correct, even with a 1-day or half day move down, we still should see a proportional reversal process whether in the form of a "U" or a "W" or a rectangle, etc.

 The 1 min intraday chart shows us what looks to be a loss of downside momentum or one coming as some light accumulation starts, this is likely the start of a reversal process, it's not where you buy even though you have the probable head fake move in, we need to confirm it even though there's an exceptionally high probability it is a head fake move, timing matters as well.


The 5 min chart has a relative positive divergence, that would be a start too, so watch for price to start losing downside momentum and moving sideways, that's where we'll find the confirmation we need and perhaps get in to MCP at the right moment with a better entry and lower risk since the break of support, it can also set a bear trap that gives us lots of upside momentum when it's ready on a short squeeze, keep MCP on the radar, it did what we would want to see it do, now lets see if it finishes.

Index Futures going positive intraday

I may look at opening that IWM call sooner than later.

Trade Idea: Adding FXP (Long)

We waited for FXP to pullback (China 25 short), it has. I'm seeing decent signals as it has broken its uptrend line and it's looking good for a long (equity) entry, options are pretty thin.

I'm going to put this in the trading portfolio although I'm pretty close to being full there.

And That's Why We Always Need Confirmation

The IWM target was hit earlier for a possible add-to call position, I didn't because of the Q chart I didn't like and because I wasn't seeing strong signals of accumulation on the stop run, since we have moved lower.

However right now there's some swelling volume on some candlesticks that are looking similar to hammers, as if they found support in some areas and the volume looks similar to a mini capitulation event at least on an intraday basis.

The market did follow HYG lower as well so it is still in play with some algos.

In any case, the point of the post is, if we do in fact have a mini capitulation (selling climax) intraday, this would be where intraday 3C signals would start to improve. If that's the case, then I may again be looking at adding some call positions or leveraged longs, but only on confirmation.


UGLD and NUGT Position Updates

It looks like both our UGLD (3x long Gold) and NUGT (3x long Gold Miners) positions both saw head fake moves this morning, the volume is consistent with stops getting hit and there was a very clear level of support that those stops would have congregated below.

I'm loaded with both so there's no adding there for me, I might look at a call position "if" the signals intraday get to the point that I can't look away from them. For now though I'm not concerned with either position, I'm just keeping an eye on them.

GLD
 5 min leading positive, there was a 2-day intraday support zone that was very clear, you can see volume jumped up as stops were hit and/or shorts entered, this is fine thus far with this 5 min leading positive divegrence, it puts the probabilities of this being an intraday head fake move pretty high.

 Intraday there's a small "W" type base forming, I don't think this is all there is as the 2 min is positive, but not hugely so, I might look for a little more lateral movement. If charts like this start flying positive, a GLD call may be in order, I'd be looking for April monthly calls in that case.

NUGT 3x long GDX/Gold Miners
 The same type of move is evident here as well, support broken and on volume, but a good 15 min leading positive puts probabilities in the camp of a head fake move, but timing with options or leveraged positions is more important so I'm still watching intraday activity here.

 NUGT 5 min has held up well for a break like that, if it were more than a stop run I'd expect deterioration, it has held up well thus far.

NUGT 1 min is a relative positive, it's not too different than GLD's intraday charts, these are what would have to improve a lot intraday for me to consider adding to a position in these assets or add more heavily leveraged positions like calls (although I do have a GDX call open as well).

Otherwise as far as NUGT and UGLD positions (equity longs), I'm not concerned about them considering the support zone being so obvious and volume showing stops were run.

IWM Position Update

As you know I have weekly IWM $116 calls in place, I was considering adding some longer dated (maybe April standards) at $115 or so on a break below $116.19 which happened.

I still like the IWM position...
 IWM 2 min leading positive...

But, unless there's a significant change, I'm not going to put any more attention toward the broader market , again unless there's a significant change. These are speculative positions on a small base and what concerns me the most is the QQQ chart below.

This 3 min chart is not looking great so I don't want to commit any more than the speculative half size IWM weekly $116 call already in place.

I'd rather make a new round of trades in to a move higher seeing the market is so weak it can't even get a 3 min positive divegrence on deck.

That's my thinking right now, again, if things change and probabilities look better, then I'll look at it again.

For now though, I'm setting my alerts, keeping an eye on developments and moving on to other assets.

Keeping a VERY Close eye on IWM

IWM has hit my target, I may be adding some calls, very speculative and short term.

If you don't like options, but may like the trade, there's the 2x and 3x leveraged IWM long ETFs, UWM and URTY.

Some Key Moves are Taking Place

First the IWM is moving closer to the level at which I would consider adding some calls, but with some new information developing, I'd have to feel darn certain and I may cut the expiration to a nearer weekly expiration like 1 week out (not this week, but not monthly either)... the reason?

It looks like what I've been looking for (the reason for the market action over the last week and this "W" base/ascending triangle over the last 2-days), VXX accumulation and the "Flying divergences" we only see in VIX related assets, may be developing finally. A move higher in the market, even for a day or 2, even for only a couple point may be all that is needed to take this seed of expectation and grow it out to full bloom, the primary trend change signal via VIX futures.

Let me try to show with charts (you can see what the IWM is doing and you know the level I'm looking for it to break under on a quick head fake-$116.19).

VXX / UVXY Short term VIX Futures & VIX Futures.

Remember, VIX/VIX Futures "typically" trade opposite the market, but during the February rally they had a much stronger relative performance than they should have, protection was being sought and the long term charts look good, however, when the VXX is ready to move, meaning the market is about to drop, we see these unbelievable divergences look like they are flying, much stronger than a typical leading divegrence and we see them in VIX products because fear is the strongest emotion in the market, when there's fear, there's a flight to safety and protection, VIX futures are that protection.

VIX Futures...
 VIX 1 min futures are accumulating right now.

As are the 5 min in the same area

And right out to 15 min so this is a pretty strong divergence to hit a 15 min chart that quickly.

VXX / UVXY Short term VIX Futures...
 This is a good looking 5 min VXX chart, it's nearly where it needs to be, but for 3-4 weeks I have been waiting to call this out as a new position, I have not seen the short term 1-3 min signals flying and thus I have waited, good thing too considering the choppy performance, but now... We are getting movement.

 The 1 min is starting what could be one of these "Flying" divergences, that's what I've been waiting for.

The 2 min chart (UVXY 2x VXX) is showing the same, in other words the migration of the divergence is present here as well as VIX futures giving us better confirmation that this is something to pay attention to.

The VXX 3 min is nearly there, but not quite..

This is what these charts should look like when VXX is ready to move, THAT IS OUR SIGNAL FOR A DOWNSIDE MOVE IN THE BROADER MARKET AND A BIG ONE, NOT A MOVE DOWN FROM THE LAST 2 DAYS.

This is what a flying divergence in VXX would look like (more or less), very steep, very vertical.

If the market can pop to the upside a bit, VXX can finish accumulating and give us this signal, that's why this move has been important to me beyond a small 2 day base.

Gap Fills in Place

Now that we have gap fills in place, we are just starting to see some initial signs of a probable trend change toward lateral, this is the same pattern all week, gap up, fade the gap and then move sideways and accumulate a bit.

I'm still looking for IWM to break under $116.19 before I add anything.

I'd remain patient, this pattern seems to be here for a reason, meaning I think the "W" base will fire, I am NOT sure of its performance, it may be quite weak considering.

IWM gap fill...

If I use the standard measured move, the target for the IWM would be about 2 points above the base which is around $120.

The SPY has a different pattern, more of an ascending triangle, although it's in the wrong place for the price pattern according to the dogma of technical analysis, however most traders don't know or care about the rules or confirmation of a pattern, they see a pattern and assume it's real. For instance a bullish ascending triangle like the SPY has should have diminishing volume and most importantly, it's a consolidation/continuation pattern meaning it "SHOULD" follow a preceding uptrend, not down. In any case, the measured move for the SPY would be $189.50.

The Q's measured move would be $90.50 on another ascending triangle in the wrong place- a PERFECT head fake set up and the DIA would be about $166.

As far as signals for an imminent move, they are not there yet.

HYG CONTINUES TO TRY TO GET THE ALGOS TO BITE, IT ALSO CONTINUES TO DISTRIBUTE.
The HYG gap up may be part of what is causing the market to gap up, in any case on each move higher the distribution is deeper and deeper, it's in bad shape not only near term, but at the entire stage 3 top for the Feb rally.


No Surprises

Fade to the gap, not a big surprise, it didn't look like we were quite there yet, but there's not a whole lot to this area, I'll show you (don't forget about last night's HYG post as it has been the legs under the market and its losing its own).

These charts are a bit old, from at least 30 mins ago, they are power cleaning our buildings for painting and seem to have knocked out service or something else, but I had to grab my "To Go" bag and relocate to service.

 As for the SPY, there was no confirmation of the gap up...
 SPY 1 min

SPY 2 min

We still have a positive divegrence that can move the market, but note that it stops at 2 mins, the bulk of it is through its 2-day duration.

Here's a 3 min chart...
 We aren't even seeing confirmation here much less a positive divegrence on 3 min. Some of you have asked what the other charts look like, there's not much after 2 and 3 min charts, there aren't any surprises in the 10-15 min timeframes, in fact they are still quite negative so you aren't missing any surprises.

 SPY 5 min is in leading negative position, NOTHING HAS CHANGED AT ALL HERE

QQQ-the story is much the same except intraday charts don't even look as good.

 This is the 2 min non confirmation of this morning's gap.

IWM-this is my favorite and why I opened IWM WEEKLY calls and may add April monthlies if we get a good head fake stop run.

Again, 1 min no confirmation for the 3rd day in a row...

 2 min is where our positive divegrence is for the most part.

Take a look at a 5 min chart though, you can see there's NOTHING BEYOND 2-3 MIN CHARTS.
 
Here's a 15 min IWM, leading deeply negative, this is what we see in intermediate and longer timeframes, nothing has changed, still VERY negative as if we are at a transitional area from stage 3 to stage 4, that doesn't mean we have an instant change in trend, look how long these trends take to turn, days, weeks, etc so nothing abnormal here either.

A.M. Observations....

It's another overnight, a.m. market ramp... lets see, that makes the fourth in a row.
 ES/SPX E-mini futures overnight with a positive divergence on the 1 min in to 4 a.m. just after the European open and pop goes the ramp with more gusto than yesterday.

Is this a news or data driven ramp? I doubt it, I think it's nothing more than our letter of the day which is "W"
This is the "W" bottom of the last 2  days or "W" base, it's the reason we opened longs for a short trade like SPY weekly calls Monday and closed yesterday morning and new IWM calls yesterday to take advantage of what the market has clearly been showing us.

Three of four of those ramps failed miserably soon after the open. Was the market conditioning traders to fade the open again today? I don't know, we will see if there's confirmation today on the gap opening, there hasn't been on the 3 days the market faded the gap open.

I have the IWM weekly calls in place, I planned on adding April monthlies if the IWM broke below $116.19 on a head fake move, that could happen, if it doesn't that's fine, I'm not chasing.

I'm also not worried about this ramp as far as shorts go, I've left a lot of trading shorts in place and all core/trend shorts in place, I just made some changes where there was good reason, for instance DUST/NUGT had good reason on the charts, we'll see if there's anything else that gives us good reason to make a move for some extra profit, otherwise, like my favorite trader, Livermore, says, "Sit tight".

I'll be looking early to see if there's any kind of confirmation, even if this turns out to be another "Fade the a.m. gap", it may just be to fill the gap and may turn right around, in any case there's opportunity on positions we opened for this which are small and speculative and there may be additional opportunities on new positions, I'll let you know what I see.

Have a GREAT day, HOPE that the VXX gets knocked down a bit so that will accumulate and the market can start making some real moves that are more than 1% (on the downside).