Friday, June 1, 2012

The Bearish Picture

Something big is going on in the market, something that is going to take bears by surprise and really test Jesse Livermore's advice, paraphrased as, "It's not being right on the market that makes you money, it's the sitting". A lot of people were right on the market direction, very few made money though. This speaks to the courage of your convictions.

I have a lot of new data from today to pour over, We've expected this top would end with one final, very strong bounce and have thought that since before May. Around the middle of May we had good evidence for such a bounce which has built since then. Today the market gave away many more clues than yesterday, it's always in the heat of the moment that small shifts occur in different assets while everyone is focussed on one thing, "SPX down 2.47%". It's during these emotional extremes that you find the best nuggets of information, kind of like beach combing, you find the best stuff after a strong storm. I have a lot of analysis to do and I'm not sure where it will lead, perhaps to our long held expectation or perhaps something bigger, but something big is brewing. If I discard all of my technical indicators, all I've learned about the market, I can still make this argument based on one simple fact, the market is a zero sum game, for someone to in, someone must lose and that can't happen with everyone on the same side of the trade.

The recent bearish trade has been too textbook, too obvious and if there's one thing we've learned by simply observing, it's that textbook and obvious are almost always the doorway to a nasty trap.

However, before I look at the new data and try to fit the pieces together, it's important you understand just how bad the market truly is. Years of research have gone in to this so it can't be all detailed in one post, but the main theme that ties all of this together is the world being a much smaller place now than it was 20 years ago before globalism, free trade agreements, new financial derivatives exploding. We are in an era where almost literally, a butterfly flaps it wings in Asia and we have a hurricane here and vice versa. Europe's structural problems were set in stone with the creation of the EU, when a sovereign country can't control it's own money supply in a fiat system, it's just a matter of time. One of the main catalysts was the housing crisis and debt in the US, we gave Europe a cold, they came down with pneumonia and the contagion is spreading across the world. There's no historical precedent to look to because the wold has never been through such a financial crisis and been this interconnected.

Lets let the charts do the talking.

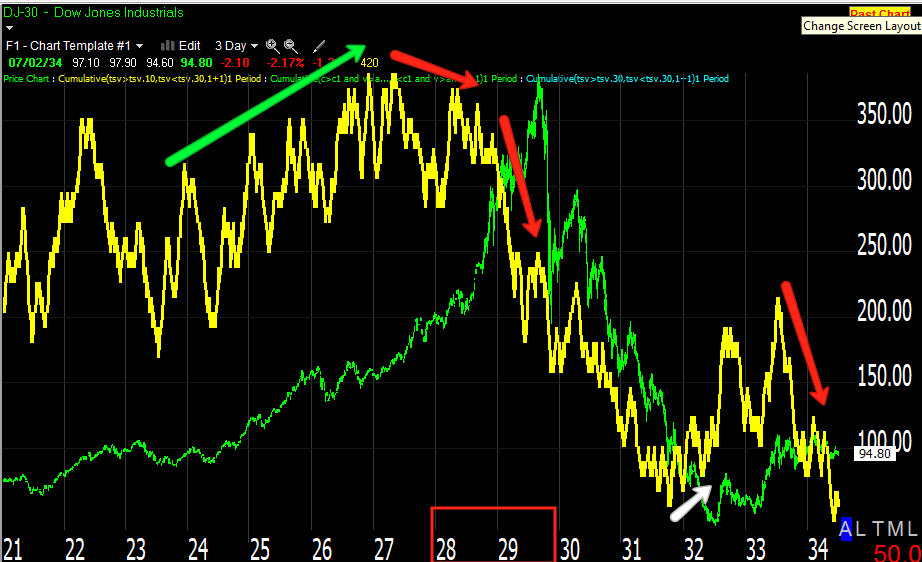
First I want to give you a feel for a market crash and what 3C looked like, there's none better than 1929.

 Here you can see the accumulation period between 1918 and 1921, to the right, distribution, note that 1929 wasn't a complete surprise, money had been moving out of the market t least a year before, however when the top came, 3C was deeply divergent.

 This chart shows a little more detail of the distribution period leading to the crash as well as a small base in 1932 that failed in 1934.

 This is a closer view of the 1932 accumulation and 1934 distribution.

The early 1940's saw accumulation, heavy accumulation, note that there was selling in to strength as prices went higher, that's part of the human fear factor, taking gains too early. The 1960's were pretty stagnant.

Now for the Dow now...
 Here 3C looks very strong with the Dow, both making higher highs until the late 1990's which led to the 2000 Tech crash. The 2007 top was even more divergent or at least deeper, the actual top came very quickly. Note 3C from 2009 on. This may look totally wrong, but you have to understand most of the gains in the market were artificial because of the QE programs and POMO. The depth of this divergence should be worrisome to long term investors. In long term analysis I have said in 20 years when people look back at this period, I wouldn't be surprised if the called the 2009-2012 period the biggest bear market rally in the history of the market. Economically we are in no different or no better a position than we were at the 2009 bottom.

I included Money Stream which is Don Worden's signature money flow indicator, the code is totally different than 3C, but the divergence is very similar.

Here's a closer look at  2009-present
The 2007 top was quick distribution, things changed fast. The first two distribution periods in the Dow were as or after QE1 and then QE2 ended as they were the only real support for the market, artificial monetary policy created that support, also note how each successive top has been more negative than the previous one. You could call this the QE House of Cards, clearly without QE the market wants to collapse back toward what would probably be fair value considering the economy. Right now the market is higher than 2005 when everyone had money to spend, employment was normal, the only reason the market is higher is because of monetary policy, not organic growth or even the prospect of it.

This indicator is derived from 3C, the deeper the indicator, the more distribution. In red is the 1929 crash, obviously we can't compare apples to apples as there's a lot more money in the market than in the 1920's plus other factors such as inflation, etc, but the 3 most recent major tops can clearly be seen.

The S&P
 A daily chart of the S&P-500 since 2005, note the 2007 top and the same lower 3C through the 2009-present, each top also coincides with QE ending, the current reading is at new lows below the 2009 bottom.

 The chart with the effect of the removal of monetary stimulus.

 I mentioned earlier that the last really strong accumulation period we saw was Aug.-Oct. 2011, the distribution at this current top has been very sharp and very strong.

 Volume should rise with prices in a healthy rally, note the only time over the last 40 years it didn't was since the 2009 rally started. If we view the last 3 major tops together with the preceding uptrend, it looks like a secular H&S top. The standard price pattern implied target would take the S&P down an impossible 825 points from the neckline at 750. While that is impossible, 750 is probable and if this is a major top, then 500 wouldn't be out of the question, it would in fact be reasonable.

 3C moving up with price in confirmation from the early 1970's through the 1998 area, then institutional distribution in to higher prices in to 2000, every top since then has shown less money, deeper negative divergences, a market that is rotting from the inside out.

The same chart with no annotations, the trend and the historical price history offer proof.

I planned on including many more charts showing the deterioration of market breadth, commodities, how we discovered the recent top before it formed, etc, but what is important is to show the condition of the market.

As confirmation of the S&P bearish position I'll also include Money Stream's take, as you'll see, this totally different money flow indicator looks very similar.

Not only is it similar to 3C, but to the Dow as well, again note the 2009-2012 period, the market is exceptionally weak at exceptionally artificially inflated prices, in other words, it is ripe for the mother of all crashes (unless the F_E_D steps in again, but they can only kick the can down the road so far and each time they do, it makes the situation worse).


Closing ES

I can't even fit the entire persistent positive divergence in ES on one chart.

 Overnight and morning hours ES

Morning and regular hours ES

We've been using 3C on ES for probably 9 months now, it gives incredibly accurate intraday signals of each and every jiggle in the market intraday. In March for the first time we saw this kind of action, a persistent divergence. I remember the first time I saw it, I didn't know what to think and thus far we have only seen negative ones.

Looking back it makes sense, for the amount of time we have been using 3C on ES, there were no major accumulation or distribution events. The accumulation that kicked off the October rally from the October lows had been accumulated from August to October, we weren't using 3c/ES then so we wouldn't have seen it. There was enough accumulation during that 2 month period to pretty much push the market higher and there was distribution in to higher prices, but nothing as extreme as what we saw in March as the market started to top, so that was the first time there was a really strong accumulation/distribution event. It was strange, but it was correct. As the market rallied or bounced (the last day of each bounce event included 3/19/2012, 3/26/2012, 4/2/2012, 4/17/2012 and 5/1/2012) we were selling short for longer term short positions or "core" positions for the longer term. We also ran a bunch of options trades during that period both long and short and made from 7%-244% on those short trades, usually only 2-3 days, but the main focus was selling short in to strength as our goal is, 'Let the trade come to you". There are too many assets to trade to take sub-par set ups. Nearly every short we initiated or added to was stalked, meaning we were patient, we waited for the price strength, then the 3C signal that the move up was failing and then we shorted. GLD was a classic stalking trade that took about a week, but gave us a 215% gain in several days. BIDU took even longer, but it did EVERYTHING we expected from breaking out to the upside, to the breakout being  head fake move, to moving down on strong momentum from the head fake breakout. This entire trade was planned before it even made the first step of breaking out and is now at a 22% gain with no leverage and hasn't even come close to the halfway point of our target. We also had a BIDU put that made something close to 100%.

I got away from the point, the point being is this rare event in 3C/ES only seems to happen when institutional activity is extreme. This is actually the first persistent ES divergence we have seen that is positive so something big is going on, we've known something big was coming, but it is even bigger now. I'll try to figure out what the tactics are as the larger strategy seems to already be in place.

However, just to avoid confusion, my next post will show you how much trouble this market is really in. A lot of people have targets of a 20% decline (we're at less than 10% from the top as of today), we have a much different view on the long term picture, one that could include the true first secular bear market in equities, we've seen them in commodities, but no one alive has traded a secular bear in stocks. He who figures it out first will be the winner and considering technical traders still haven't adapted to Wall Street using TA against them (over 10 years now and worse each passing year), I doubt the retail crowd will fare very well.

So next post will show you the big picture, ironically I did a 5 part video series in 2007 predicting this very event, I didn't know how we'd get there, how long it would take, but I thought we'd see the Dow below 5000 before it was over, things have only gotten worse since then.


USO

I'm going to hold the USO calls. I'm not seeing amazing signals in USO today, but Energy looks good, USO looks decent and the $USD looks horrible.

No notes because of time.
 USO 3 min

 USD 3 min

 USO 5 min

 USD 30 min

 USO 30 min
 Energy 1 min

 Energy 3 min

 Energy 30 min

 USD 1 min
USD 2 min

The Little Things

You neve know where you're going to find the little things. As a famous trader once said, "To make money you have to see what the crowd missed".

My sentiment report is the bears are out of control over on twitter, our member who keeps tabs floated a trial balloon after I mentioned to him when you get cocky and think you've got the market in your back pocket, that's when you are about to take a fall. So he went over there and posted "Would anyone go long?" and was "ridiculed". He knows how bearish the market is, much, much worse than what we have seen recently, I need to do a big picture post, but he also knows how Wall Street plays the game as he has been with me as long as I've been doing this.

Any way, Credit leads, equities follow. High Yield Credit is the choice of Credit traders, they are much smarter and trade much bigger markets than equity traders, how many retail traders do you know who trade credit? Probably none because it's a huge market, much bigger than the S&P Futures.

Like I said, for a risk on move, High Yield is the credit of choice and it's pretty cheap right now. I wouldn't rec'd trading this ETF, volume is too low, but it tells us what's going on with those who are really in the know, thus the phrase, "Credit leads, stocks follow" which has served us well in many a reversal.


Here HY Credit intraday is coming undone from the SPX and trending higher, interesting.

Quick SPY Update

 SPY 1 min-yesterday I wanted to see a pullback to see if 3C would behave like it is today, yesterday's lack of signals was certainly made up for today and by the way, the move below the APEX of the pennant would certainly do everything a head fake move is intended to do. Like I said in my reply email last night, this is an extreme market and whatever you think is probably reasonable-double that and you are probably much closer to the target.

 SPY 3 min today and the trend. While there have been a number of smaller divergence, all conveniently placed at areas that either form the pennant that would be VERY obvious to any technical trader, or the divergence is at the head fake breakout move. The trend of 3C overall during the pennant is what is important.

 This is the exact same chart above, just without all of my markings, look at the trend and a 3 min chart could easily move down to price by mid morning, it didn't, it remained near the highs of this entire pennant starting on the 18th.


A longer term.timeframe view-SPY 30 min, there's a lot of confirmation (I could mark every small divergence, but that' not the point), the main events are the May 1 top/negative divergence and the recent 3C trend on a 30 min chart, especially in the pennant area since May 18.

ES Update

Talk about persistent divergences. Every time in the past these have gone on for several days I've had the occasional email, "Is 3C not working right?", remember 3C is suppose to contradict prices. In every instance of Es showing a persistent divergence like this, the market made a big move, the last was on May 1st in to a persistent leading negative divergence as prices were moving in a parabolic move up. That same day we not only predicted the fall and the move to be a head fake, but exactly what the fall would look like. I and many of my long term members have had enough experience with 3C to trust its signals, we may not know why smart money is doing something, but we know they are up to something that price doesn't reflect yet and this is how we've been able to set up some of our best trades.

A broken watch is right 2x a day? Yes of course eventually the move will come, but 3C has proven its value in that the moves come and surpass where the divergence first started, FB yesterday was a perfect example, had you bought on Tuesday when the divergence first started (it was very small on Tuesday), yesterday you would have been in the green and I don't think FB is near done.

Now, ES...

Stepping back, the divergence is even bigger than first thought.


Something Big

Sorry for the radio silence, but I've been jumping back and forth between layouts trying to put together a lot of new information.

Other than out long term VERY bearish veiw on the market, we've known for a while that something big is going on that is not represented in price, as always, PRICE IS DECEPTIVE.

Many of you hve heard about this, but years ago I use to get the research reports for the trading department of a major Wall Street Investment Bank, all of you would recognize the name. I obtained them legally-at least from my side, but this is the deep down nuts and bolts that the trading desks make all of their decisions with. I thought I hit the jackpot with an inside line in to one of Wall Streeet's biggest investment banks, but the information was useless. I tried to follow the implications and it seemed absolutely useless until about 6 months later I dug up one of the old reports and looked at the market, exactly what they were planning happened, except it didn't happen until months after. In retrospect that makes sense as large positions and reversing strategies takes time, but the point is, Wall Street works in front of the market by a comfortable margin. On small bounces we have seen them setting them up several days in advance, on bigger moves sometimes months in advance. I have shown the charts of homebuilders probably a dozen times, they were being accumulated during the 2000 Tech crash, some went on to make nearly 5000%, but after the tech boom, who in their right minds would have thought housing that appreciated in the single digits a year would be the next bull market? Wall St. knew and years in advance, I have shown you the 3C charts of them under accumulation during the Tech bubble.

The point is, we have had confirmation everywhere that there are huge positive divergences, May 15th seems to be an important date. We knew the $USD would have to fall and the Euro gain, or at least the $USD weaken and we have the charts to show that is what they've been planning, but we had no idea how.

Here are the Euro and USD charts with 3C telling us something big was underway, it was the when and how we didn't understand.

 Look at the leading positive divergence intraday in the Euro today

 Longer term, this 30 min chart with a huge leading positive divergence has also been part of the "Something big". The negative divergence sending the Euro lower is about right for the downtrend, this leading positive is not right, something bigger is going on. Also note the date where it rally gets going, May 15th, the same day I looked at 3C on both currencies and asked , "Do they know something we don't?"


 Look at the $USD distribution today, no doubt the NFP is part of it, but this has been going on a while.

 Rhe intensity is picking up now-$USD 2 min 2 week trend.

 $USD positive divergence was big enough that the uptrend should have been much longer, the leading negative on a 30 min chart shows something changed and again-May 15th was the date.

The Euro on the NFP print, but is this the start of the catalyst that fulfills the divergences seen above on the long term charts?

I have a lot more information as today is yielding a lot of new information and clues. I'm going to try to focus on the market right now until the close and then gather all of this new data and try to figure out what the tactics of this "Something Big" are, strategically we have known about it for a while through the 3C divergences, we just haven't understood what exactly they are up to, but all of it points to much higher prices.

ES Update

 First let me say the point of a 3C signal is to contradict price movement, that tells you something is going on that price doesn't reflect. If you look from left to right, the first negative divergence was 3C at the same level although price had moved higher, that move higher was being contradicted by 3C and although it was small, it led to a small downturn, the second divergence was just before the NFP print, again price moved higher, 3C moved lower, you saw what happened next.  During the opening trade, price made an equal high, 3C made a lower high, once again it contradicted price and price fell to the a.m. lows, from there a large leading  positive divergence developed, the underlying action is what creates the strength. We already know that a leading divergence is the strongest type, but when it keeps trending higher and isn't giving intraday signals anymore it is because the underlying action that is creating this leading divergence is so much stronger than any of the intraday signals, they simply don't show up. Many of you may remember when we were accumulating shorts in to bounces and price strength near the top's highs, 3C was doing the same thing except as prices moved higher it was in what I was calling, "A persistent leading negative divergence", the distribution in to higher prices was so strong that intraday signals wouldn't show up. The result of that? All of the shorts opened in to price strength are at a gain from AAPL at a +7.53% gain (no leverage, just an equity short) to BIDU at 21.6% gain.

To put the regular hours divergence in to context...

This shows the overnight trade as far back as I can go.

Better Signals

Yesterday as mentioned there weren't very many good signals, you may recall I wanted to see the market pullback to see how 3C would react since we did violate the pennant (a possible head fake move), although not by much and we didn't close below it. In any case, on a head fake move you have to be able to confirm it as being such and not the real deal. In a situation like today with a strong break below that pennant (which is what traders are looking for and is what gives them price confirmation to enter positions), you want to see good signals like we saw on the GLD head fake trade or BIDU, AAPL (before earnings) and others. Yesterday's lack of signals was downright frustrating, again that's why I wanted to see that pullback but the Euro formed a consolidation and halted it.

Just browsing around today, the signals are much better, I'll probably be posting different ones as I run across them, but Tech has been of particular interest to me. Here's what Tech looks like today vs yesterday.

 XLK 1 min didn't show a trend yesterday, it gave good intraday signals, but no trend was apparent. Thus far today a trend is apparent. The leading divergence is much stronger than yesterday's relative divergences, this is why you don't see any intraday indications like yesterday, there's one thing dominating this time frame.

 The 3 min chart yesterday was similar, less detail, but it showed the positive divergence at the a.m. lows, confirmation through most of the afternoon and a negative divergence at the close. Now the 1 min chart's strength  is bleeding to the 3 min chart which is near vertical is a leading positive divergence.

The 5 min chart overall shows a few key events, the confirmation of the head fake move on the 29th, price pretty much in confirmation after that but most importantly the leading positive position that developed yesterday afternoon (although it wouldn't have been completed and wouldn't have looked the same yesterday) and today's refusal to move lower keeping tech in a leading positive position on a big move down.

Last night I was responding to an email and just passed along some things I've learned about the nature of the market over the years. Here are a few of my responses...

"It's always like that, the market moves and surprises the most people at one time and catches them off guard. I think I told you, from experience I've learned that however long I think it will take for a move to occur, double that and you are probably closer to correct."


"The market always swings in extremes, way further in both directions than you think is probable, kind of like the time element."


"Yeah, it'll probably come when you least expect it, this is an extreme market, it wasn't like this in March when we could predict a reversal to the day, but the market was reversing every 3 days."


Remember this was last night, I think we have the answer that I alluded to in my response...


"Almost nothing happened today, I was looking around everywhere and there just wasn't anything going on, days like this happen infrequently, we had one not too long ago, I think it was right before the AAPL earnings when there wasn't a good or bad signal anywhere, it's like Wall St. is in hibernation, I'm sure we'll find out why soon enough."

FB Update

Yesterday I opened a Call position in FB (June $27), in retrospect I should have gone with July, but I'll likely remedy that in the near future. FB is kind of interesting as you saw the strength of the divergences yesterday, the first time any positives have shown up since it started trading. Based on their IPO fee and how much support they threw at 3 different price levels on the first day ($40 and $38 being the last two), I can't see how MS is not at a significant loss from the first day of trade. As I said yesterday, I see no fundamental reason why FB would rally now-there's no new initiatives from the company, oversold is a hard argument to make for a new IPO that has a valuation that is insanely high, the only thing I see as probable is MS and perhaps GS trying to recover losses and being they are two or at least 1 of the most well connected financial firms if not the most well connected (specifically GS), it's interesting that they chose the date they did to start the move; they and any one in the market for 6 months knows the market exerts the greatest gravitational pull on individual stock prices on any given day.

Here's the FB updated charts, I'm holding the position for now and may look to roll it to July.


 FB 1 min showed some selling late yesterday near the close, then a positive divergence today in to the a.m. lows, a small negative as FB moved up a bit and as it came back down another positive divergence starting. I won't speculate on yesterday's late day selling (which is only intraday-it's not enough for me to be concerned about the bigger picture/premise of yesterday's position), but I would say today's minor negative divergence looks like market makers working an order.

 FB 2 min, even if you aren't in the trade or interested in it, this chart is revealing with regard to how orders are filled and the role of market makers/specialists, May 31 on the open there was a negative divergence sending FB to the lows of the day, from there a strong leading positive divergence and although it looks like there was accumulation throughout that period, some of the specific points are pointed out and you can see each of them is at the lows of a minor pullback. You can see the late afternoon negative and today' positives that are now at a new leading high, although this is no where near as large as the positive divergence at yesterday's lows. Also note the positive divergence at yesterday's lows is in the tell-tale flat trading range where we commonly see divergences, I believe this is market makers, etc trying to create stability in prices to fill an order at a customer's specific requested price, we just see this too often to think it is coincidental.

 The 3 min shows the start of the positive divergence I mentioned on the 29th, it has grown immensely since then at lower prices.

 The 30 min chart reduces the noise of intraday divergences an uncovers the trend, FB saw 3C confirmation of the downtrend the entire time until the 29th, where the positive divergence started. Even though we don't have much historical data for FB to judge by, a 30 min positive divergence that is leading and develops so quickly is an important signal, it's why I took the trade. I would say MS/GS has a significant amount invested in accumulating shares on the cheap, I'd expect much higher prices in the near future.
Although we don't have a lot of data for the Trend Channel, the 30 min version held the downtrend well, the stops for a short (downtrend ) are always the lowest point of the channel, the downtrend wasn't violated until the character of FB changed and ir stopped out at the red arrow. Currently for a long position, the highest point of the lower channel is the stop which is currently at $27.55, this should allow room for consolidations and will lock in gains as FB moves higher. If this becomes a larger move, we'll need to use a wider channel to let FB consolidate.

Market Update

For some of you who haven't seen a lot of 3C charts and had experience with them, this post may be a little difficult to follow, I'll try to make it as easy to understand as I can.

ES updated chart-still moving higher. Although this is just an intraday signal, accumulation is a bunch of intraday signals like this all accumulated together. Institutional money's orders are so large if they placed them all at once they'd drive price against their position. (buying for instance, if they placed a 10 mn share order at once, it would drive prices way higher as everyone front runs that order, but if they break them up in to 10k share orders no one knows the difference, 3C tracks that trend). Then there's the fact there's even a positive divergence on such a horrible NFP print, most people wold think the underlying action would be all selling.

DIA 1 min-yesterday there were very few signals as mentioned yesterday and today, I suppose it makes sense with the whisper number and the day before the NFP print that smart money wasn't extremely active. However the 1 min chart is the fastest, it can move with price nearly in real time, the fact the DIA 1 min chart is above yesterday's readings rather then confirming price with a move deeply below is an interesting divergence.


I's very difficult to see, but the bear pennant (pennant portion of the pattern) starts around May 18, the upside head fake move that broke out of the pennant was on the 29th where you see a negative divergence in to higher prices-confirming that was a head fake/shakeout move. What is interesting is the position currently of the 2 min chart, confirmation alone would see the indicator below the lowest readings on May 23rd, a leading negative divergence would see it even lower, but the indicator hasn't moved down at all. This would of course be read as a strong positive divergence.

DIA 5 min from the 18th on (the pennant), remember red are negative divergences, green is price confirmation, the yellow arrow is the breakout (head fake) from the pennant which saw distribution, meaning that breakout was sold in to to knock it back down as it was a head fake move. Again by this time in the day the 5 min chart would be caught up to price, there's no downside confirmation and the DIA has been one of the more erratic charts of the majors. The red trendline just shows price lows and where 3C was relative to those lows, price is much lower than the 23rd, yet 3C is much higher, again that's a relative positive divergence (relative between 2 points).


The 15 min DIA clearly shows the head fake move at the yellow arrow and the negative divergence in to that move, as price dropped, 3C went in to a leading positive position as the pennant matured. Again 3C in confirmation (no divergences, just confirming the price move) would be at new lows, the fact it isn't seems to indicate there's institutional activity right now.

Cleaning up all of the noise of individual smaller divergences that are intraday or day to day, the 60 min chart reveals the trend. Look at the size of the negative divergence at the May 1 highs, not very big, although at the time it seemed pretty decent size. Compare to the current divergence, also note there aren't many divergences that reached the 60 min chart, the top on May 1, most of the rest of the time 3C was in confirmation with price, and now the current one. The longer the timeframe, the more important or larger the divergence is. Usually a 15 min chart can turn prices, when we reach 60 mins, we are usually talking about large trends, for instance just look at how far the DIA has fallen just from the May 1 negative divergence.

The IWM 1 min chart this morning is not only not confirming downside, it's headed in the opposite direction in a large leading positive divergence.

Here's the 2 min IWM with a positive divergence at yesterday's morning lows sending price higher, the divergence in the 2 min is being fed by the 1 min chart, it too is in a leading positive position. Confirmation alone would see the indicator much lower, at least where the blue arrow ends.

IWM 15 min chart is very interesting, the IWM is a barometer of a market rally's strength, the IWM / R2K should lead a rally, even Bernie in Congressional testimony pointed out the "wealth Effect" of QE and didn't use the benchmark S&P, he used the Russell 2000, so you know what the F_E_D is watching, probably because of the R2K's diversity. The green arrows are my attempt to draw in the pennant portion of the bear pennant. Note how the leading positive divergence has grown stronger as it moved closer to the apex of the pennant.

QQQ 1 min with the positive divergence at yesterday's a.m. lows sending the Q' higher, for most of the afternoon price/3C was in confirmation (green arrow), right now 3C is in a leading positive position as it did not move down to what should have been new lows on this chart just for confirmation, distribution would see it even lower.

QQQ 1 min longer view-the yellow box is the head fake breakout day, you can see the distribution or selling in to the head fake move to send it lower and as price moves lower, positive divergences form (buy low-simple principle). This also gives you some idea of the current positioning and how important it is when comparing where 3C was at the head fake move and where it is this a.m. Again red arrow=negative divergence/distribution, white=positive / accumulation and green=price/trend confirmation.

QQQ 3 min prices are continually knocked down at the top of the pennant and see positive divergences at the bottom (buy low), market makers/specialists have the ability, it is their job to push the market around when trying to fill an order, it is not uncommon for them to move the bid/ask and feed out shares to moves prices down when they have moved too far away from the target zone which is usually identified using a VWAP., again the current position today is much higher than it should be.

QQQ 15 min pennant, at the yellow arrow is the head fake break out move and distribution, note the increase in positive 3C activity as it is in leading positive position near the end of the apex of the pennant.

Like all the others, SPY 1 min is leading positive this a.m.

SPY 3 min showing the head fake move in yellow and the leading positive position the last several days including today, the orange arrows represent where 3C should be on simple price confirmation and lower on a negative divergence/distribution.

The 15 min chart is impressive, note the May 1 top and negative divergence,  the entire bear pennant is in a leading positive position.

With the size and length of these divergences, if we don't see a super strong move before the F_O_M_C meeting, I'll have to re-consider whether QE 3 may have been leaked. I hope that isn't the situation as it would be very unpredictable and we have enough market manipulation w/o the F_E_D involved, but I have to be realistic.