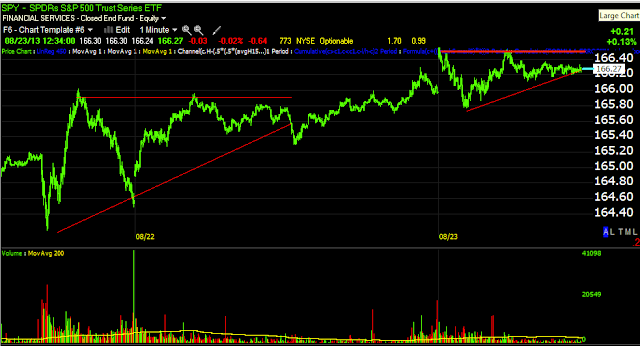
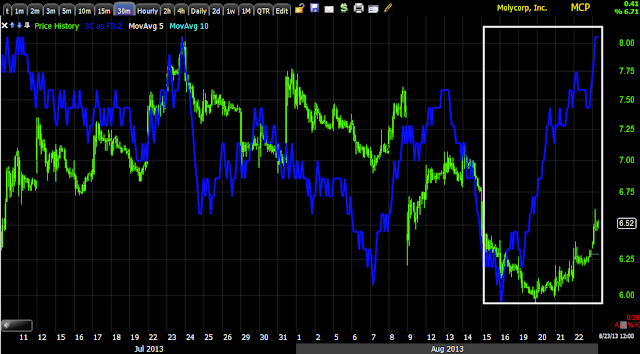
So far Leading Indicators are not really jumping out accept in one area and it may be the most important,
Credit.
First lets look at the others (all leading indicators are compared to the SPX in green unless otherwise noted).
First commodity weakness yesterday has flipped to commodity strength, commodities are risk assets and despite their plunge over the last year plus on weakening global economics, they still should show some interest in a risk on move. Today's turn up has other elements to account for, but it may be part of a leading signal of an impending move to the upside.
This is commodities vs the $USD in green, commodities and the $USD typically have an inverse relationship, if one is up, the other is down
so I inverted the $USD's price scale, this way if commodities and the $USD are tracking together we know commodities are moving because of the $USD and the correlation, however commodities shot higher today well above that correlation again, perhaps an early leading indication of a risk on move.
FCT as a sentiment indicator (back to the SPX) was extremely weak yesterday AFTER the NASDAQ went down, I don't know how much that impacted the fund, but today we have a flat range which is not a positive leading indication, it is a vast improvement over yesterday.
Our second sentiment indicator HIO us making higher highs today vs the SPX which is making few, this is a stronger positive signal.
Now the important stuff, CREDIT...
Junk credit is High Yield by the nature of its risk, but it trades a lot like High Yield Corporate Credit, the fact it's leading the SPX and very similar to HYG is notable, both made abrupt "V" reversals that I was not comfortable with,
but since HYG has filled out a more appropriate base and leading positive divergences to 60 mins.
Here's HYG, note the reversal data of the 20th, it's also leading the SPX,
"Credit leads, equities follow".
Now look at the difference in my custom TICK chart right around the 20th
The 20th is where the white line is, there's a vast improvement in the TICK data since.
In addition to the positive divergences and the size now of the base which is much more respectable,
these HYG 3C charts say a LOT
HYG 10 min built a base after the ugly "V" reversal and is leading positive.
Very few (I can't recall any at the moment) risk assets have a leading 30 min positive like this which is now moving...
over to a 60 min chart.
In other words, HYG looks well supported and HYG can support the market upside very well.


