Monday, September 30, 2013

Daily Wrap

I thought I'd do a video for tonight's wrap, I'm using some different software so hopefully the sound and video match up better.

There's an embedded video player below and here's the link to the video on YouTube.

As for futures so far tonight, the 1 min 3C chart for the Index Futures looks very negative, I'd guess they'll see at least some sort of move down in the next hour, however the 5 min charts seem fine, so this should be interesting.


Coming Down to the Wire

In just over 8 hours, 1/3rd or 800,000 Federal Employees will be shut down and out of a paycheck and it doesn't seem like much is getting done to change that eventuality.

Still we have HYG positive on some impressive timeframes, although it has taken on some water in the 5 min range.

There's a VERY slight positive tone or less negative among many of the averages.

In addition TICK data is leaning more positive.

What I found interesting is that the reach for protection via VXX and VIX Futures is not supported as well as you might think, the earlier half of the day had better 3C support and the afternoon has a negative divergence.

Unless something changes enough to really inspire me, I feel like we have a nice set up for long entries, that would be the short term strategic view, however the short term tactical view (the timing of entering those positions) is still off.

AFTER CONSIDERING THIS I'VE COME TO THE UNDERSTANDING THAT DESPITE THE HYG POSITIVE DIVEGRENCE AND OTHERS, AT THIS POINT, WITHOUT THE SHORT TERM CHARTS GIVING A CLEAR TACTICAL ENTRY, I BELIEVE TAKING A POSITION WITHOUT THE INTRADAY CHARTS IS AKIN TO GAMBLING ON THE OUTCOME.

WE ARE NOT GAMBLERS, I DON'T THINK I'LL ENTERTAIN ANY MORE ENTRIES UNLESS THRE IS A SIGNIFICANT SHIFT AND THAT LOOKS VERY UNLIKELY, BUT WHO KNOWS WHAT TOMORROW BRINGS.

Opening XOM Nov. $85 Call Position- Normal Size

ERX is 3x leverage Energy Bull ETF, not exactly the same as XOM, but unlike crude/USO, ERX is the Energy sector as XOM is more like the energy sector than specifically oil.

If you don't care for options, my choice would be ERX long.

Market Update

This is a tough one for timing, I think if I were in a position in which I didn't have any long exposure for a short term move, I'd probably phase in to a trade or two, maybe half positions until or unless a more solid looking entry comes around, but I already have pretty significant exposure.

The SPY Arbitrage model is positive by $.60, suggesting the SPY is undervalued. The ES CONTEXT model has been above and below fair value all day but by only a few points and is currently above and suggesting ES is underpriced by a small amount as well, which is a big change from last week when it was clearly in the negative by 30-40 points.

The TICK Index is useful for these situations as well.

 The 1 min TICK on my custom TICK indicator doesn't show much, but at 5 mins a positive trend emerges.

As for SPY intraday charts, the 1-3 min look mushy compared to the 5-15 and even 30 min.

SPY 5 min looks like it has no doubt.

To transfer this quickly to a 15 min and even on a 30 min, really looks like there's little doubt.

It's still the QQQ that is the laggard, almost as if it has nothing to do with the rest of the market today.
 The earlier negative intraday divergences are clear on the 2 min QQQ, but I have to wonder as all new divergences start on the earliest timeframes, whether the 1 min chart below is telling us something.

A slightly positive tone developing.

The IWM is probably closest to in line of all the averages, it is not perfectly in all timeframes or intraday, but close.

The DIA is mixed and of little help.

So that leaves HYG.
 HYG 5 min with accumulation picking up late Friday, then adding this today.

The 15 min chart which didn't see any migration Friday, added this entire leading positive today and that's impressive for a 15 min chart.

 However the 1 min intraday suggests a pullback and that is what we've started.

The pullback signal stretches to the 3 min chart for now so it seems likely it pulls back.

The question remains whether these longs are only effective before the close as whatever happens would be more likely to happen before midnight or if it is worth waiting on the proper intraday signals as usual.

I'll probably be looking at each asset and judging on a case by case basis keeping the overall market in mind.

Once again, the choice between probabilities and high probability, low risk and excellent entries.

Of course I'll let you know if I enter anything before I do. The thing I can't really get past is HYG is a smart money asset that has done a lot of positive work today, unless those divergences fall apart a bit before the close, it almost seems inevitable that the market will move higher.

TRADE IDEAS & MARKET UPDATE

As I showed in the last post, there are some underlying currents that started to really take off from last week's mediocre positive divergences as of Friday. In fact I have a video I made Saturday afternoon addressing the underlying trade Friday and the changes there which I though were strange going in to what was almost certainly going to be a weekend with no good news, but you never know what smart money knows and that's why we try to follow what they are doing; I may put that video out later.

I'm not sure that we'll get a very deep pullback today before any potential upside, the government is suppose to shut down (or about 1/3rd of it) at midnight tonight, so if there's going to be a deal struck, I'd imagine it would be before then and the market response would come in the overnight session.

Still I want to be careful as to how much risk to take on and where as this could all still go south.

I'm going to look quickly at Leading Indicators and mainly follow HYG as it seems to be where smart money is expressing their opinion the most.

The assets I've identified (interestingly it's not bullish across the board, the same as last week, for instance, although PCLN would likely draft the market higher, the 3C signals are leaning much closer to a short and therefore PCLN would not be a candidate for a long position).

The assets I have found and like include:

TECL 3x long Tech (long)
FAS long or XLF calls
XOM Nov. $85 Calls or XOM long. Alternatively, ERX long, although I don't like it as much.
UNG is very close to a long, but I think I'd wait there.
SPY looks good, I'm looking at Nov. $167 calls, otherwise the ETF would be UPRO 3x long SPX , there's a 2x long as well.

I'll get back with you in a few minutes after double checking everything, remember there's still a lot of fundamental (unpredictable) risk in this, but if HYG continues to develop, it would seem smart money knows something.


Thinking of Increasing Long Exposure on Pullback

Take a look at the market averages... There's a HUGE shift in character that started last Friday from weak positive divergences last week to increased positives Friday. Now that HY Credit is starting to go nuts, I think smart money knows the outcome.

 SPY 5 min, large positive recently

SPY 15 min and 10 min is positive as well


Even the 30 min is moving now.

IWM 5 min at the head fake of the ascending triangle

IWM 10 min with a large move.

The Q's are the only thing making me think a pullback is probable, but I'm going to look around more, I may or may not give weight to the Q's.

 QQQ 2 min

QQQ 3 min

The DIA also looking positive on the 5 min

all the way to 15 min

XLF of course positive at the 15 min, I still like Financials (XLF or FAS).

This is the smoking gun, it started Friday of last week.
 HYG 2 min

HYG 5 min

HYG 10 min

HYG 15 min.

This is what I'd call a smoking gun, with accumulation at 15 mins that fast, I'd say there's very little chance that the market fails to shoot higher.

I'll probably be looking mostly at leveraged assets such as options or more likely 3x leveraged ETFs.

TLT (20+ Year Treasuries)

Treasuries gapped up last night on the open of futures trade for the new week, however I wrote about this last night and showed not only negative divergences in Treasury futures, but the fact that the market was far from being open meant what we were seeing was low volume correlation/guess work. Now those markets are open, things look different. The 10 and 30 year futures have both given up all of the gap up gains from last night and are trading below Friday's close.

The November TLT Put, amazingly is still at a double digit gain as we got in that position right at the top while upside momentum was still strong so an excellent entry has kept that position at a double digit gain.

Here's a look at the longer end, this is where my interest is both on a short term market manipulation basis as well as the put trade and on a longer basis as a possible long play (TLT) on a decent pullback, hopefully to the $100-$102 range or below, although that feels like a lot to ask for right now. The one lesson I learn and re-learn over and over again is not to underestimate the market's penchant for moving to extremes that are typically 2-3x more than what may seem reasonable and often either 2-3x faster or longer than what seems reasonable. This is only natural being the market is a mass of millions of different emotions, even the computers were programmed by humans. The point being, TLT @ $99.50 is not at all unlikely, it's quite possible.

10-year Treasury Futures (15m.)  now trading below Friday's close as Futures opened at a leading negative divergence here last night.


 30 year 5 min also with a leading negative on the open of trade for the new week last night.

30 year 15 min leading negative as well.

TLT 20+ year Treasury
 TLT intraday negative on the open sends it below Friday's close.

The longer term 2 min chart, still in good shape for the put trade, remember I never expected or wanted to see heavy distribution here, I'm more interested in a TLT long position than a short, but at a discount on a pullback so I don't want to see any core strength ruined.

TLT's 5 min negative right at the highs, which was an easy entry as we got in to puts at a deep discount as price looked very bullish, the next day TLT puts were at a double digit gain and have been ever since.

I'll continue to hold the put, but on the first decent momentum move to the downside I'll be looking to close it and on a move under $102, I'll be looking for signs of accumulation to enter TLT long as a core position, if anyone has any great ideas of how to leverage this up, but still maintain liquidity, I'm all ears, the leveraged ETFS are very illiquid as are most longer options.


Market Update

As you can probably tell just from the ROC in the market averages, we have intraday negatives for a pullback from here, they are in all of the major averages (from 1-3 mins) and the Index futures (mostly only 1 min).

The SPY looks better than most and the QQQ looks the worst of the 4 majors, but again these are only out to 3 mins, beyond that at 5 mins, most of the averages and Index futures are positive.

This looks like the normal a.m. gap fade trade.

I'll bring you some more on several assets.

GDX / NUGT Follow Up

Here are some of the more important charts, there's not only a good short term momentum trade (call options), there's a good swing long trade and an even better long term trending short all set up or setting up.

I'll use GDX as the example, but NUGT is the same.

 This is a long term 5-day chart, it shows a large "Complex Head and Shoulders" top that is about 3 years in the making. Even complex tops tend to be symmetrical, this one has two left and right shoulders and 4 heads or you might call it one large head.

The long swing  or even short trend trade as well as the set up for the long term trend trade set up are already in place.

The 3 areas I'll short a H&S top are very different than the areas Technical Analysis suggests. T.A. NEVER suggests shorting the top of the head as they consider that, "Picking a top", but I'm not trying to pick a top, it just happens to be that when 3C is giving a short signal, it's often at a top so that is the first area that is also the best with the least risk.

The second area is the top of the right shoulder,  this still gives you a good price point and lower risk (not as low as the head, but decent).

Technical analysis says to wait for the H&S top to break below the support/neckline, this is the worst place in my view, you are chasing price, you have a lot of upside risk and most of all, these patterns "use" to test resistance and fail, now they test resistance and break out above the neckline to shake out shorts that entered below the neckline. You can already see the bear flag setting up a large head fake move and capitulation-like volume in the area, this is a perfect set up for the shakeout of shorts who will remain in the trade at a loss because they expect the neckline to provide resistance when in fact the neck line resistance will fail and price moves above, putting a number of shorts at a loss and covering which sends price even higher, this is the shakeout we see so often now in a H&S top.

This brings us to the last and least favorite place to short a H&S, it's on the move above neckline resistance after a short squeeze pushes price higher, often near the top of a right shoulder. This is the last decent price point entry with lower risk.

So the major 5-day chart's bear flag should fail, a move to the upside should start which will pause at the neckline  as more shorts jump in on what they believe will be a successful test of resistance, then price should break above the neckline putting all of the shorts at a loss and creating a snow ball effect of upside momentum as their covering (buying) sends demand up, taking price with it.

When we get there, this is a long term trending short entry.

THE MEASURED MOVE, IMPLIED PRICE TARGET ON THE DOWNSIDE WOULD BE AROUND $11.00 WHICH IS JUST BELOW THE 2009 LOW SO IT'S NOT THAT OUTLANDISH.

The upside move from here should be in the area of $50, this is why I prefer a 3x leveraged long ETF that can be held without the problem of options' Theta (to capture the longer trend)


 Volume is VERY important in identifying a true H&S vs. patterns in the clouds that may look like something they are not. In fact, volume is probably the single most important confirmation of a H&S top. Volume should rise on declines and fall on rallies, I drew in where volume lifted on declines at the red arrows as should be. The major volume break below the neckline is shorts coming in, but the more recent, larger volume looks just like capitulation (reversal) volume. It looks like all sellers and shorts have been exhausted and there's little supply left. Most importantly, look at volume soar in this flag/consolidation area, the exact opposite of what it should be doing in a real consolidation.

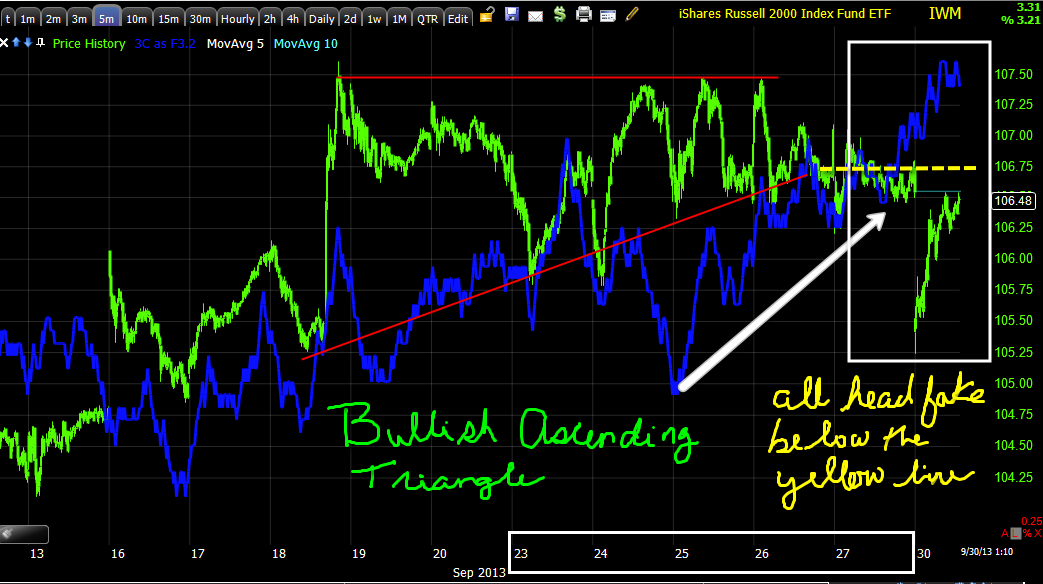
 On a 15 min chart we see a bear flag that should have led to the next (large) leg lower, it was a head fake that broke to the upside and then a bull flag that should have led to a move higher near the top of the range that was a head fake as well and pulled back more, but no serious damage. The range can be seen, although there's a much larger range in play as well.

 3C at the failed flags, in line when it should have been negative if the bear flag was real, a leading neg. divergence at the top of the range to pull price back and a bull flag with a failed break lower that was accumulated Friday in a leading positive divergence.

 Friday's 3 min 3C chart at the flag failure.


 A strong 5 min leading positive as the lower prices of the failed flag were aggressively accumulated.

This is the 5-day 3C chart of the entire top pattern, notice the strong accumulation in the current flag below the top's neckline? This suggests that price will do exactly what was described near the top of this post.

Adding to NUGT (long) Trading Position

When we get these decent days down, I'm always interested to see how the CORE Equity tracking portfolio is doing as it is large, way more positions than I'd ever trade and that effectively dilutes gains, you might have noticed, I'm not a believer in "Modern Portfolio Theory", I do believe in diversification, just not over-diversification, especially when there's so much correlation and so little rotation among sectors.

In any case, these days down are a preview of how the positions should perform when we get to our primary trend and primary positions and I'm happy to see that the CORE Shorts with a couple of longs in there are not only in the top one quarter of 1% vs all other portfolios on the day, but outperforming the SPX by 400%. This to me is a sneak-peak of how these positions will perform in a primary downtrend. Obviously I'm happy with the positions' performance at 400% of the SPX and in the top one quarter of 1% vs all other portfolios on the day with so much diversification.

As far as options go, I already have enough exposure to Oct and November GDX calls, I can't add anymore to those, but if I could, I would here.

I do have about a 1/2 size open NUGT long meant to be a trading position, I'll be increasing that to a full size position.

Ideally I'd say the best NUGT entry would be below the $48.30-$47.45 range (BELOW either of those), I don't mind not waiting on the ideal entry, but if you are playing the market with a lot of patience and waiting for positions to come to you in the best form with the least risk, then those would be the levels I'd set alerts at.

I'll bring the position up to 75% from 50%and add the rest on a break of $48.30 if we get it.


Trade Consideration: GDX / NUGT

Overnight I couldn't get a sense of gold, the charts were foggy for futures there, Silver and Gold futures had different divergences, but both were very close to what I'd call the middle in this case, that's not in line, it's really the worst reading in 3C, the one that has no value, it doesn't tell you much one way or the other and that happens from time to time, I think in large part because smart money is not always active or at least is not actively pushing a hard opinion that contradicts or confirms price.

However after looking at the 3C GDX chart this morning, I thought, "I'd have a very hard time telling a member that I didn't think it was a buy", it looks great. Then I saw the relative performance between GDX and GLD and liked it even more.

I'd DEFINITELY consider GDX calls or NUGT long here as a new trade or an add-to position.

I think it may move quickly, thus this written post only with no charts, but I'll get them up next.

Morning Futures

There haven't been any real substantial changes overnight except in a disappointing Chinese Manufacturing PMI print and some in Berlusconi's party are threatening to quit unless he takes a softer stance which has sent the Euro back above Friday's closing levels as it gapped down hard last night (how quickly things change).

The $USD lost more ground overnight, but it does have an interesting 15 min positive reading. The Yen is stronger since last night, but 3C looks a little toppy there.

Both the 10 and 30 year Treasury futures that gapped up last night, as I suspected, are both back down to Friday's closing level, giving up the entire gap up open for the new week.

As for Index futures, it's still the IWM looking most interesting.
 ES 15 min is pretty much in line

NQ 15 min gained ground in 3C overnight

As did TF Futures

Even the 1 min TF futures are growing more positive.