Here's what we ended up with, but there's something far more important unfolding and this just goes to confirm that.

Again, until Friday, none of this would have inspired buying, however part of our theoretical reasoning for the bounce/rally, whatever you want to call the short term move up we are looking for is precisely to change sentiment and get retail feeling bullish, get them buying so you know who can sell and short in to demand, that's almost always the reason for moves like this and tonight would not be the first time by a long shot that I have mentioned that I believe this is EXACTLY what this move is intended to do, so much so I linked my two articles, "Understanding the Head-Fake Move" for you in the original post of "What I would do if I were thinking like a crook" in the 4/17 "Positions" post. Hopefully this all gave you some perspective last week of what was most likely to happen and why.
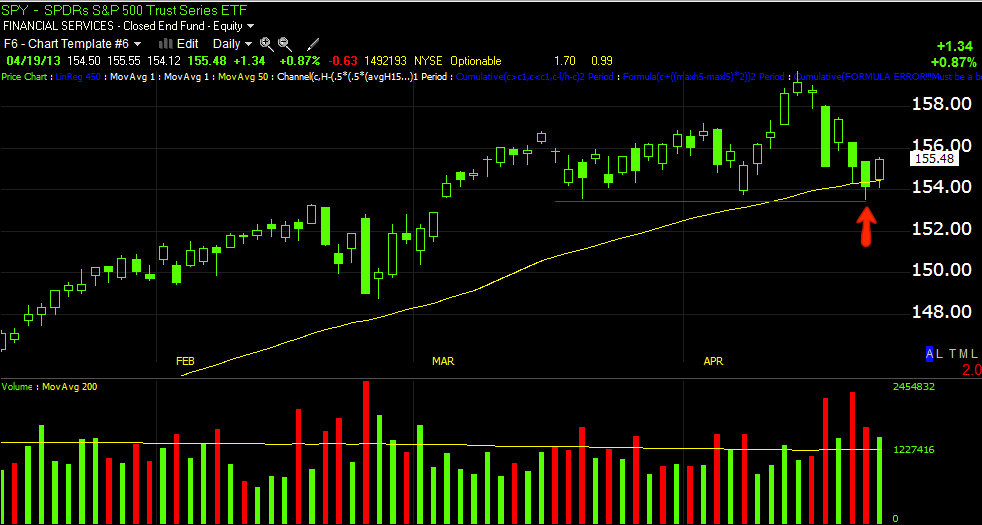
As you know on Friday and probably before, I noted in numerous posts the "Inverse Head and Shoulders" pattern forming. This MOST obvious of technical price pattern bottoms have inspired many of you to email me this weekend with some of your thoughts on what this is all about as you "Think like a CROOK", what the different head fake moves could be, what the potential angle or manipulation is.
First let us examine the Inverse H&S Bottom (one of the most recognizable and often least confirmed via volume, technical bottoming patterns).

The smaller IHS is marked with yellow arrows and is the more traditional or simple, from left to right, left shoulder, head at the 4/18 lows and right shoulder not quite completed.
These price patterns do have an affinity toward symmetry, meaning two left shoulders, then two right shoulders, in a truly complex bottom, even multiple heads are seen (although I don't think we need worry about that.
The point is, up until the low of the pattern, the head, was made at 4/18, to most traders this would look like nothing more than a downtrend and they would not be inclined to buy it until the Inverse H&S bottom became more clear which it did on Friday, now everyone is seeing this pattern and becoming bullish on the market. *Let me point out that with this pattern as well as with the H&S top, the symmetry between the number of shoulders is very common, but a flat neckline is not, meaning these patterns whether tops or bottoms can and often do slant, in this particular case that would suggest the right side of the bottom pattern perform better than the left side and the neckline would slant upward from left to right with the first shoulder to the far left in the larger IHS pattern slanting from somewhere around the $158 area upward, they can also slant downward meaning prices would likely underperform a bit, but the actual breakout from the bottom would occur a lot sooner.
Keep in mind, this is VERY much consistent with the reasons given for this shorter term (of the two moves-the second being a larger move down) market move as explained last week, to sucker in longs, to change sentiment from bearish to bullish and to get retail believing in the move and buying it so the pros can have sheep to sell/short to-this reasoning has NEVER changed since we first suspected this move.

This is a closer look at the potential Complex IHS bottom pattern with red arrows and the smaller IHS pattern with yellow arrows. *Note that even the smaller pattern (yellow arrows) is still given a strong propensity toward symmetry, it would seem very near term, like Monday or the first half of Monday that it pullback a bit closer to a symmetrical pattern represented by the lower red trendline. Since these necklines can slant, it doesn't mean that it has to pullback all the way to the trendline, but believe it or not, to make retail feel more comfortable, it's best this pattern look as close to the textbooks as possible and this is a pattern even someone with a month's knowledge of Technical Analysis would recognize.
In effect, this is a VERY effective wolf in sheep's clothing, making retail feel comfortable that they have identified the most well known of bottoms and inviting them to buy in to it, WHICH AGAIN IN THE ENTIRE REASON FOR THE PATTERN AS WE ESTABLISHED DAYS AGO LAST WEEK.
As for proof of this wolf in sheep's clothing...

The 15 min SPY chart shows a positive divergence through the entire pattern even if you start at the first shoulder of the larger Complex IHS, which is the one I'm more inclined to trust. However while Smart money has been accumulating (as we have too on the signals for a shorter term move), retail wouldn't have seen this bottom until Friday, before then it just looked like more downtrend-lower lows and lower highs so their ability to buy has been significantly less, which is fine with smart money because they want retail chasing higher prices that Smart money can sell and short in to and retail is perfectly willing to do this under the Technical concept of "Price confirmation".
It's actually a quite beautiful, if not utterly deceptive trap.
As for other confirmation...


This same pattern is seen in NASDAQ futures, HUGELY in Russell 200 futures which is special because the R2K "should" to confirm strength, lead any move to the upside, it's also in the DIA and the IWM VERY CLEARLY. In short, every Index futures and Every equity index has the same signal, smart money which we followed on this move in adding positions at the same time they did, has laid the plan out very simply...
The point of the move up is to get retail to trust it, to be impressed by it and to buy it while smart money will sell in to it and make money as it has to go up any way and then will sell short in to it as they have been doing, here's some proof of that...

So to the matter of the emails and members' embracing the "Think like a crook" mentality to understand Wall Street's games, I have heard some great possibilities, but I would submit this to you...
Since we identified the first vestiges of accumulation, what has our expectation been? It has been that Wall St. would use this move up to change severely damaged sentiment with a strong, impressive and most importantly, Believable move to the upside to ensnare more retail and better position their larger portfolio positions that can't be easily turned without demand and volume, this will do it.
So, rather than pull small time head fake moves (which I don't rule out, but I give less weight), I think...
The most important aspect to their success right now is not to do anything to scare off an already shaky retail, they should keep their eye on the prize which is to get retail to buy this move so smaller head fake moves run the risk of damaging the confidence of retail that they are clearly trying to gather with an Inverse H&S price patter, THE MOST RECOGNIZABLE PRICE PATTERN OUT THERE.
While I think some downside short term (as mentioned, maybe part of Monday or Monday) will serve to create the textbook look retail is use to seeing in this pattern's symmetry, that is not something that spooks retail, it gives them more confidence as the pattern looks like they would recognize it and thus draw in more confidence (even though most technical pattern bear very little resemblance to the 1 in 100 charts used in a book to demonstrate the pattern-real world is just different).
Along those lines, so far futures look to me that they will send price a little lower and complete the symmetry in the pattern that is missing now, but not too low to spook retail traders.
While futures can change quite a bit overnight, here is an example...

The QQQ


In looking at futures tonight, the Market Index futures all seem to look like they want to pullback, perhaps on a gap open or early action, to the symmetrical level, what I haven't figured yet is the Single currency futures like the $USD, the EUR, the $AUD, in fact all but the Yen, look very bullish for the market to move higher, they all have very supportive 3C divergences in the same timeframe as the Index futures short term pullback signals. Perhaps they are there for support to move the market once the short term symmetrical goal has been reached, on a kind of standby to support the market to move it higher.
In any case, the positions we picked up late last week should do very well this week, we'll look at new positions and management as the signals become apparent and stay a step ahead of price.
While I want to encourage all of you to keep thinking outside of the box, looking at the market from a different perspective, I would say in this case it's more important to look at what the real goal is, what the real manipulation is and I suspect they aren't going to try to make a few short term bucks with head fake moves that endanger the head fake move that means the most to them, however as always, I'm open to interpretation and changing my views if need be, but I need hard evidence to back it up.
I hope this all makes sense, I hope you had a great weekend and a great week ahead.
If anything changes substantially in the futures tonight, I'll let you know.


