Thursday, December 4, 2014

Daily Wrap-More than meets the eye

Today's surprising and seemingly endless ECB shenanigans in which Draghi's 90 minute press conference came off a lot more hawkish than many or any had anticipated (remember a fair portion of the market have been expecting QE/sovereign bond purchases to be announced today-far from it), Draghi's comments almost seemed to kick the QE can way down the road until later this afternoon when Bloomberg ran an un-sourced story that the staff of the ECB were preparing for new measures which the market again interpreted as QE, despite the fact Draghi not only did not say anything about QE, but he even said the ECB's purchases would be reassessed NEXT QUARTER and some other hawkish toned comments. Equity Futures ended the day lower from Draghi's comments...

Why the Bloomberg rumor came up is unknown as well as their prompt retraction and the disappearance of the retraction posted on Twitter, but I believe this has something to do with an internal struggle at the ECB in which it appears Draghi just lost his majority, which was reflected in late day trade -the last hour and a half or so.

So for all the "Buy the Dip", "The F_E_D has our back", "The ECB will pick up the QE baton", they just suffered a massive moral defeat as those who have voiced opposition to any such plans have outright broken with Draghi, putting him in the minority, if he were ever actually considering QE beyond rhetoric and ambiguous statements he could easily back away from.

In other words, all of the nonsense from the ECB today, looks like it was more of a power struggle that Draghi appears to have lost along with his majority, or because of the loss of his majority as reported this afternoon by Germany's Die Welt:

This is Google Translated so it's not the best, but from Germany's Die Welt, the death of the Draghi majority...

"The outlooks for growth and inflation are bleak. Mario Draghi will therefore open the gmoneyates - and is met with increasing resistance. And on the ECB's Executive Board, he has just lost the majority.
According to information obtained by "Die Welt", internal resistance to Draghi is now larger than previously thought. He can no longer count on a majority within the Board currently. In the vote on the official opinion of the Governing Council on monetary policy are for information of the "world" three of the six directors supported by the President to the original tune.

In addition to Sabine Lautenschlager and Yves Mersch, who had already previously expressed skepticism about bond purchases, one can now add the Frenchman Benoît Coeuré who is against Draghi's course.  ...There had been dissenting voices within the Board on several occasions, but there was always a majority behind the President."
The entire day was all about the ECB, rumors, retractions and truth as well as a last minute surge to keep the SPX green for the week, while the NASDAQ and high Beta Transports are lagging.
  At 1 the market laments no QE from Draghi and his press conference taking on a more hawkish than usual tone. At #2 Bloomberg runs an un-sourced rumor of preparations being made by ECB staff for a January "implied" QE plan which was retracted as the market slid lower in to the afternoon and at #3, the Die Welt article above about Draghi losing his majority on the ECB's governing council and at #4 a little ramp to keep the SPX green on the week, or at least that was the effect.

Often we see things in 3C, money flows that we don't understand and to wait to understand what they are about is to miss the trade, by the time it's common knowledge the opportunity is long past. As you know we have had a series of macro trends and one of the stranger ones is a strengthening Euro and a weakening dollar, thus perhaps a stronger EUR/USD. 

Today with the death of QE or at least no life given to it, the strengthening Euro sent the $USD lower. However, as reported by some as an attempt to ramp the market, the USD/JPY made a trip to new highs above the psychological level of $120 and quickly fell back, as we noted right as it was happening today, THIS WASN'T A LEVER OF MARKET SUPPORT, BUT A LAST CHANCE SHOT AT STOPS ABOVE $120 AND EAST MONEY BEFORE THE WEAK $USD DRAGGED THE USD/JPY OUT OF RANGE OF HITTING THOSE STOPS...PERIOD!

 Does this chart os USD/JPY (candlesticks) vs ES (purple) look like ES gained ANY support from the USD/JPY's move ...ironically to stops at $120 after which the FX pair promptly failed to the downside sharply?

PErhaps between the macro trends of a stronger Euro, weaker $USD with QE now over and a stronger Yen, the days of Central Bank planned economies are coming to a righteous end as Abe may lose his Abenomics mandate in snap elections and Draghi just lost his majority...in that case, the stronger Euro , stronger Yen and weaker $USD on a stronger Euro would all make perfect sense (the macro trends).

As former PIMCO co-counder Bill Gross said today, (paraphrasing), "How can central banks expect to right an economy full of debt by issuing more debt?" Would that work for your household? Of course my opinion which is irrelevant is this has never been about anything other than a stealth banking system bailout as the 2008/2009 bailouts were wildly unpopular with the US voting public, what better way than to use QE which no one outside (and very few inside) the market understand?

While probably not as big of a deal as the developing ECB rift, today did put in the second Hindenburg Omen in 3 days, more on the bearish Hindenburg Omen here for those not familiar... While I'm not a huge believer in it's 100% accuracy, I'll admit we did have a couple right at the September highs that led to the 2-week 1200 point Dow sell-off to the October lows.

As predicted Monday in the Meet Your Levers update, TLT, HYG, USD/JPY, Yields, VXX, VIX and SPY Arbitrage all supported the market Tuesday and Wednesday for the forecasted oversold bounce that we saw coming as early as 10:30 a.m. Monday morning after a parabolic sell-off and large short term capitulation volume-a short term selling climax. And as shown yesterday, Levers Update all were denied to or already failing.

For example, TLT trading up today and Treasury yields on the whole up 1-4 basis points on the day; HYG closing red in to mid-day distribution, VIX accumulation which we covered in detail yesterday via VXX, UVXY and XIV.

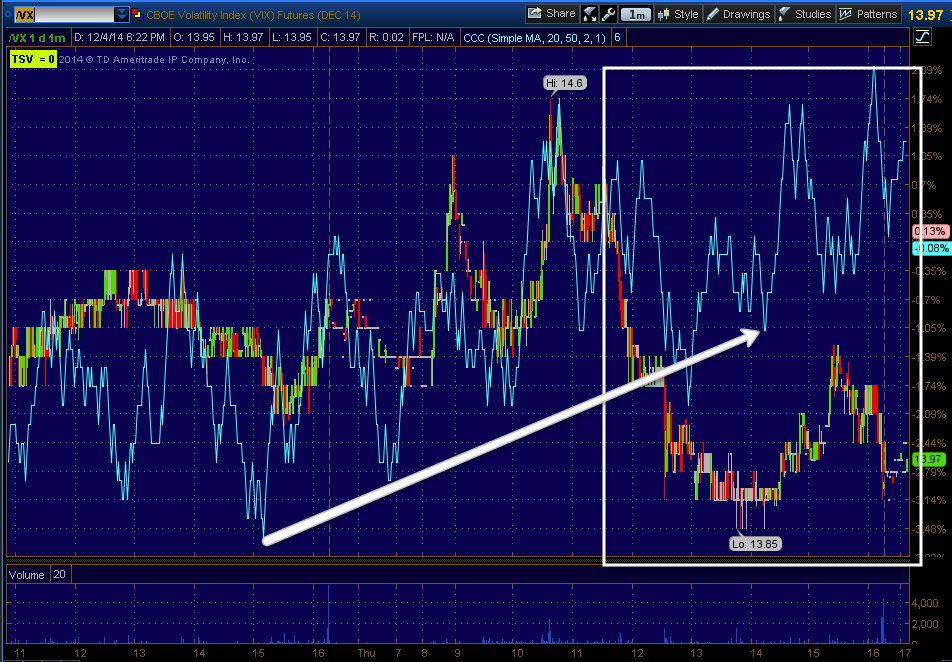
Today VIX futures showed positive divergences in to lows mentioned early in the day, but it just grew from there in to the close.
From earlier relative positive divergences in to the lows to a later leading positive divergence in to the lows. Of course this could be hedging protection in front of tomorrow morning's 8:30 Non-Farm Payrolls, but the trend seen yesterday in VXX was significant.

As seen in Leading Indicators we not only had interesting VIX activity, but HY Credit continues to fail, not a 1-day wonder, but a trend and a fierce one. Pro sentiment continues to fail. Yields reversed and Treasuries were bid in an apparent flight to safety trade, our VIX term Structure indicator that has called nearly every decent bottom with readings at elevated levels above 1 saw the lowest reading in at least a year and a half, in fact going back and looking tonight, today's level of 0.80 was the lowest since 3/15/2013 at 0.79 and while I don't use the indicator for anything other than a buy signal, I counted at least 4 times when readings under 0.85 led to significant pullbacks over the same period mentioned above. Yields were also down today as mentioned (1-4 bps from the short end to the long end), they tend to pull the market toward them just as they did the last 2 days as they rose.

The 10 year closed @ 2.25% and the 30 year at 2.95% today, the worm has turned as yields have been one of my favorite leading indicators next to high yield credit and 3C.

In fact, going in to tomorrow's NFP (8:30 a.m.), I dare say we have not had such large single rally divergences ever since using leading indicators in HY Credit and Yields.

 30-year Yields vs the SPX as a leading indicator

HYG-High Yield Corp. Credit as a leading indicator...

High Yield Credit as a leading indicator giving the same divergences vs SPX as HYG at the July/August decline, the September/October decline and what we have now is virtually without words, at least none that can say more than the charts themselves say.

Meanwhile, VIX's range continues to tighten with its Bollinger Bands on a buy signal (only the 3rd signal for this indicator in a year and a half, the other two being dead on...
VIX daily/Bollinger Bands and buy signal...

Given all of the above, I can't understand how anyone aware of the above could possibly sleep at night being long the market when you consider...
The SPX has put in a gain of exactly +0.10%, bone tenth of one percent OVER THE LAST 2 TRADING WEEKS! At best that's opportunity cost, realistically it's pure open market risk with no good reason to be in the market long, especially given the proven track record of leading indicators and how badly they are dislocated right now.

Moving along...

Among commodities gold had a slight decline, Silver a gain and copper looks to have had a dead cat bounce, so perhaps there's a copper trade put there as the bounce ends.

As for internals, you already know about the second Hindenburg Omen in 3 days, but that's not anything I consider an edge when the mainstream media is covering it.

As for our internals, There was a Dominant Price / Volume Relationship today unlike yesterday and it was Close Down/Volume Down among the major averages components. The Dow had 14, the NDX with 52, the R2K with 1133 and the SPX with 204.

This relationship of the 4 has the least next day influence, except for this, I call it, "Carry on", in other words, whatever the market was doing, it tends to keep doing it and I wouldn't exactly call today a banner day for the market, but I suspect NFP tomorrow morning will create its own volatility.

Of the 9 S&P sectors, only 2 closed green and they were exceptionally marginal with the leader, Materials at a gain of only 0.30% and the laggard being Energy at a loss of -.87%.

Of the 238 Morningstar groups we rack, a mere 87 of 238 closed green, again very weak performance today.

I'm pretty good at seeing changes in character early, a couple of days ago I mentioned the NYSE % of ALL NYSE Stocks Above Their 200-Day Moving Average (at a mere 50%) was starting to roll over. I've applied a 5-day moving average of the indicator vs the SPX, you can see it is starting to roll over as market breadth which is already in shambles starts to decline again.
There's already an enormous divegrence as this indicator should be making new highs with the SPX, rather half of the NYSE stocks are above their 200-day, half below and it's starting to get worse.

Along the same lines near all time SPX highs, the percentage of all NYSE stocks trading above their simple 40-day moving average is at a pitiful 59%, down from the normal 85+% in 2013.

A Quick look at Futures before I end has 3C making new intraday highs in VIX futures, leading positive (See above).

Gold's 5 min 3C futures chart looks like it will see downside in the next day or so as does Silver futures  and for now Crude are in line.

Some various Index futures timeframes... (ES=SPX futures / NQ=NASDAQ 100 futures / TF=Russell 2000 Futures)

Es futures (1 min) don't look good, in fact they look to have deteriorated all day.
ES 1 min leading negative and worse through the day...

 NQ 1 min

TF 1 min

NQ 5 min

TF 7 min with this week's oversold bounce to distribution...

 TF 15 min, negative from last week in to Sunday night/Monday's oversold decline, Tues/Wed bounce and distribution today.

TF 30 min with the Black Friday (week) sentiment protection as consumer sentiment was already in the hole, the last thing they wanted was headlines of a crashing market before Black Friday, thus the save and in to distribution as Black Friday passed, our 2-day oversold bounce and back to distribution.

 NQ 30 showing the same

ES 60 min

And I expect the Nikkei 225 to follow, NKD 60 min chart...

If I see anything beyond these ugly charts and leading indicators going in to tomorrow morning's Payrolls data, I'll post it as usual.

Have a great night!

Transports / IYT Trade Idea Follow Up

Transports were mentioned as a trade set up Tuesday 12/2 in Transports Trade Set-Up / IYT. In that post I included these charts (which you can check out in more depth by clicking the link to the post above).

 First from the post above is a chart of my Trend Channel and the trend from the October lows having been stopped out which often produces additional short term lateral chop/volatility, but 90% of the time, the trend is done and there's no reason to stay long once the channel stops you out.

The trend line at #1 was from a former post as an example of a 3C concept, "Where the 3C divergence is first seen, price will surpass that area) which it obviously did by quite an amount, but this also gives you some insight as to what the accumulation process for institutional money looks like and why most reversals are a process like this rather than a "V" shaped event-just look at a bunch of charts and you'll see very few "V" shaped reversals.

 I also mentioned the "Channel Buster" concept which we've recently seen in BABA and in which we predicted on 11/10, a day BABA was showing incredible price strength with a +4.59% gain, that it was in fact a red flag and the highest probability was a sharp pullback under the channel, forecasted 7 days in advance.

BABA Channel Buster Example...
BABA had a very clear, very strong trend and the 3-days in yellow "appeared" to be a strengthening of the trend, but in actuality as one of our multiple timeframe /  various asset concepts, it is actually a red flag telling us the trend is about to change and in this case the most probable pullback for BABA (the first in this trend), would be BELOW the channel- an -11% pullback.

This is a strong concept that was able o forecast the pullback area 7-days in advance on a day when BABA was up nearly 5% and looked stronger than ever. 3C confirmed, but the concept would have held even without the use of 3C.

The same is true of Transports on the chart above which I'll produce again...

Note the upside ROC and change in character taking BABA ABOVE the channel, it's most probable outcome is a move below the channel. At the red arrow we had a price and volume distribution day on a very bearish candlestick, which was the high for transports.

In the same update from Tuesday linked above I also included these longer term charts...
 2 hour going from trend confirmation (green arrow) to an upside ROC and in to distribution, with the sharpest divegrence at the current October rally.

The 60 min chart shows several divergences including the October lows being accumulated and distribution in to the move higher.

 And the 15 min chart shows the distribution of the "Distribution Day" and then the chart in line which is why it wasn't a trade, but a trade set up.

At the end of the post I said I was setting price alerts and looking for a move higher,

"This 1 min chart doesn't show any negative activity intraday so I suspect a bounce in trannies is coming. I'm setting price alerts from $164 to the $168 area and will be looking for an excellent high probability, low risk entry as the trade either comes to us or we move on to something else."

Today IYT was right in the range I set alerts for.

In last night's, Daily Wrap I posted the chart below with the following commentary...

"looking at the daily closing chart of Transports above, considering how clean the "Shooting Star" reversal candle (yellow box) was and the following confirmation candle, it almost seems highly probable that the Dow-20 could put in a "Falling 3 Methods" consolidation/bearish continuation pattern. The only thing needed would be a real body (open to close) that remains within Friday's large bearish downside candle like the yellow one I drew in. This is a fairly common candlestick pattern, essentially a bear flag that ends as a bear flag should."

 The yellow candlestick was drawn last night and would be what was required for a "Falling 3 Methods" bearish downside reversal pattern.

Today's close...
The exact candlestick close I was looking for last night for today, completing a "Falling 3 Methods" bearish set-up reversal pattern. *It's important to note that according to Candlestick theory, there can be more than 3 candles in the pattern preceding the large day down, as long as they all remain with their real bodies (open to close-not counting the high/low wicks) inside the real body of the large bearish candlestick that starts the pattern.

As for today's updated charts, since the longer term charts are still in effect and have not changed, it is the short-to intermediate charts I was watching for in order to enter a Transports/IYT short.

 The 2 min Transports went negative last week in to the distribution day and again after Monday's flameout-1-day oversold selling climax and bounce, it has gone negative again hinting that the timing is right for IYT.

As I said in today's Trade Idea: Transports (short) IYT, it is rare to see a clean downside reversal from this kind of bear flag, there's often some volatility, although when looking at it on a daily chart it will often appear to be a clean downside reversal so there may be some opportunity for those interested if that volatility develops. Otherwise, transports are at a very high range and an overall excellent entry area with much lower risk. While I don't favor chasing anything,  I wouldn't be concerned about an entry a little lower than today's close and I'd welcome an entry a little higher if it is to be had on intraday volatility.

 I'm looking for migration of the 2 min divegrence and see it clearly on the 3 min chart showing the divegrence has strengthened as it leads negative today like last Friday.


 The 5 min chart confirms further migration and a stronger divgerence and...

The 10 min chart is clearly negative and leading.

And the 15 min chart is along the lines of the longer charts, leading negative since the start of the move in Mid-October where it was accumulated for this move.
The mid-October lows/accumulation are seen to the far left with the 15 min trend leading negative. The longer term charts are above from Tuesday's post.

Trade Idea: Transports (short) IYT

I've covered Transoports several times over the last week and mentioned a candlestick pattern last night called "Falling 3 Methods", sort of like a bear flag Transports seems to be in. While I've seen few make a clean turn without some volatility, this is looking like a high probability/low risk set up.

In the interest of time, I'll post the charts next so I can get this out as you have likely seen multiple updates, the near term charts have fallen in line.

Leading Indicators

I'm not afraid to make a trade, but I want the best timing possible. Even though this move (other than the Russell) over Tuesday and Wednesday has been a garden variety oversold bounce, I still don't want to enter a day earlier than should be and while the Index futures move towards sharper negative divergences like what was seen leading to Monday's parabolic collapse in the market, in specific assets, there are a lot of nice looking signals, but not a lot of ones that are screaming, although many are within reach of that and could be in such position in 30 minutes should they decide to move.

Looking at Leading Indicators, the last thing I'd want to be is long. However, I also don't want to be in a chop zone for new positions, such as...
 The last 6 days of QQQ action, only -0.13% of movement.

That's opportunity cost at minimum and open risk at worst.

However the broad market is starting to scream for downside...Leading Indicators are just the latest confirmation of that...

 This is my VIX Term Structure, above 1 and it paints candles white and gives a buy signal, the opposite should hold true, although I don't use it for sell signals, but if I were too, the indicator is now at the lowest point in a year and a half, perhaps more if I looked back further.

Interestingly, VIX was SLAMMED today, around the time the Bloomberg story or "RUMOR" came out, that smells fishy.

The earlier HYG 1 min positive divegrence offered some help intraday, although it's still in the red.

High Yield Credit continues to tumble and now at an accelerated pace.

 As does professional sentiment

 TLT and Treasuries are no longer supporting the last 2 day bounce and are in "Flight to Safety " mode.

 As such, Leading Indicator, Yields is leading the SPX lower (5 year)

 As well as the more important 30 year.

30 year trend warning last Friday of what was to come in SPX Monday, 2-days of levered support and warning again.

The market seems to be screaming.

Now to find the right asset with all timeframes in place. It's days like this I'm glad I'm already set up short.

ECB, Bloomberg, CNBC Shenanigan's Notwithstanding, the Market's Opinion

At least the ones who move the market...
 VIX futures intraday accumulation continues...

ES distribution continues...

NASDAQ 100 futures distribution continues...

 Russell 2000 Futures distribution continues

And despite TICK's earlier volatility, it has dies to an unbelievable range of +/- 250

It looks like those who move the market, are not moved by the rumor, counter rumor, retraction, disappearance of said retraction...

Think Like a Criminal ECB Edition

Here it is, truth is stranger than fiction!!!

This morning in Draghi's press conference of an hour and a half,  he came off 180 degrees his norm and as a hawk or much more hawkish with statements like the ECB will "Reassess Current Stimulus NEXT Quarter" and "ECB may not decide on new measures in January", apparently pushing back any potential QE of sovereign bond purchases that I remind you again AGAINST the ECB's charter, Rule 123 which you can find right here on the ECB's website...

"the prohibition of monetary financing (Article 123 of the Treaty on the Functioning of the European Union),"

Despite Draghi saying the above: "Reassess Current Stimulus NEXT Quarter" apparently putting of any dream or hope of QE (which is still not on the table as it is still against their charter and the Germans , which are the only opinion that counts among EU nations are against it) which still remains a figment of the market's immagination until the next quarter...

And..."ECB may not decide on new measures in January" which told the market that their figment of immagination of QE, may not be considered in January, despite no mention of QE, simply "new measures" and new measures to possibly be put off.

And " DECISION TO CHANGE BALANCE SHEET LANGUAGE NOT UNANIMOUS" which sounds like the Germans saying NEIN to any QE-esque measures...

We all of the sudden get Bloomberg reports today, which are promptly picked up by the cheerleaders at CNBC, that...

"The European Central Bank is considering a broad-based quantitative easing package for its next meeting in January, a source told CNBC. That would be from Bloomberg as CNBC admits, "Bloomberg originally reported the rumors"

Additionally...the comments by Draghi that Staff has "stepped up technical preparations for further measures," which a source said is in line with considering QE proposals was taken again, with no mention of anything specific and on rumors, that now instead of today's meeting, QE is imminent in January, DESPITE EVERYTHING  DRAGHI said to the contrary during his 90 minute press conference where I'd think he'd have ample time to put out all relevant information.

This is what the market was responding to earlier, but the original "source" of the "RUMORS", Bloomberg's source for European Economics TWITTED the following...


So Bloomberg retracted all of the above.

However the plot thickens...shortly after, the tweet was taken down...

Again, think like a criminal and you'll have a much better understanding of the market. In my opinion, this is much a do about nothing, but it is exactly what a LEVER looks like when all else has failed as the ECB "may" not have been happy with moves in the EUR/USD today after Draghi's press conference.

UNREAL!


QQQ Short May be On Deck

I don't want to jump ahead of the confirmation signals, but the Q's are showing the strongest intraday negative divegrence at present. I prefer more confirmation as this is a new, short (time) move up and it could use more confirmation, even though the 5-7 min charts are now in the short camp.

I figured I'd at least throw this out there so we have a bench mark for further confirmation...

QQQ intraday 3C chart is falling the fastest, however I'd like more confirmation than just this initial 1 min chart, it's a new move (parabolic up on a VIX slam) so it takes a little time for the longer timeframes to come through and to verify the divegrence is strengthening by migrating to longer term charts.

My personal favorite for playing QQQ short is long SQQq (3x short QQQ Inverse ETF).

As for Index futures, they are all showing about equal strength negative divergences in to the VIX slam / parabolic move.