Sunday, June 30, 2013

Looking Ahead

It was the week of June 17-21st that we started closing down short term trading short positions and opening short term long trading positions based on 3C signals telling us a move higher was very probable. You can always take the devil's advocate and say, "If you keep saying the market will do something, eventually it will". However, if you consider that June 2013 was the worst month for the markets since October 2012, then the best 3-day performance in the market of all 2013 doesn't seem like so much of a coincidence; nested among the worst month  of the year and beyond we have the best week (3 consecutive day performance) of the year, that's a little more than coincidence or a "Broken clock is right 2 times a day".

I'll not bore you with the email again, but as you know, over a week ago (Saturday June 22)  in an email discussion with a member as to what the catalyst could be (the signal was already there, it just needed a spark), I had said I thought it would be some F_E_D leak picked up by the unofficial mouthpiece of the F_E_D, the WSJ's John Hilsenrath. To my surprise, I didn't know the degree to which I was on the right track as three F_E_D hawks that opposed QE came out and sounded like doves making the taper that Bernie laid out in May 22nd's speech, but more importantly the F_E_D minutes released the same day. You may recall May 22nd as being the day the market put in a very serious 1-day Key Reversal, the market hasn't been able to hold above that close for more than a day.

So not only were we right on a strong move (of which it seems there's more available), but we were right on to a degree I didn't even imagine regarding the catalyst, days before the move started.

If this was just the F_E_D trying to unwind some of the volatility the "Taper-Talk" created, that would be understandable, but the one thing I can't dismiss as coincidence and I  can say about the market is, apparently they knew as the divergence was in place at least a week in advance and the market rarely does anything without a reason.

With volatility this high and the market seemingly well aware of what was to come last week on the last day for Window Dressing (Thursday June 27th), it seemed to me to be more about what I said in the email from that Saturday than anything else and that was (paraphrased), The F_E_D would rather give the market a bone than have to bail them out and we already know they have a "special relationship with institutional money as the minutes were emailed to 154 of Wall Street's largest firms almost a day and a half before they were released, allowing these firms to trade inside information (not a single firm let the F_E_D know about their supposed mistake)  and since when does the F_E_D email minutes to WS investment banks as if they were clients? The idea is we all find out at the same time, if that idea held any water, than an email would lag the release of the minutes and in a High Frequency market, that would serve no purpose. I think you know where I'm going with this.

OK, so we got through last week on the right track, that leaves the immediate future ahead. As I said the week before last and often, WS rarely does anything without a reason and those reasons often require extreme moves to achieve their goals. The divergences (positive) for a larger move than we have already seen, were in place. As you know Thursday we saw some negative divergences and expected a move to the downside, conveniently as ES futures hit a high for the week just hours before, two F_E_D speakers came out and discreetly reversed the message delivered earlier in the week that sent the market up, in fact one of the pre-market F_E_D speakers contradicting what was said earlier in the week was the same speaker who had been pushing a different tune earlier in the week.

We ended the week with the F_E_D's Williams offering a slightly more optimistic (market view) much like the first 3 speakers early in the week, which was interesting because we typically see op-ex pin Fridays stay in a range (I think if the two pre-market F_E_D speakers didn't say what they said, the market would have been above the ideal pin as it hit new highs on the week overnight, only brought down once they spoke)  until after 3 p.m. when most contracts are settled, I have no way of proving any of this, but it seemed convenient that his message was "Back on message" only after the majority of Options were settled as we typically see every Friday.

Just as a quick re-cap of some "over the weekend events"...

Jim Rogers gave an interview, a part I found interesting...

Jim Rogers "When asked about the explosive riots occurring in Brazil, Jim warned to prepare for much more, in that,

“This is the first time in history where you’ve had all the central banks in the world printing money at the same time. Europe, Japan, America, and the UK, all, are frantically trying to debase their currencies…I’m afraid that in the end, we’re all going to suffer perhaps, worse then we ever have, with inflation, currency turmoil, and higher interest rates. As I say, this has never happened before, it’s never been a good policy in the long run, so I’m afraid we’re all going to suffer for the rest of this decade from this crazy, crazy money printing.”

As a final comment to investors looking to protect themselves from these impending disasters, Jim said,

“The way to protect yourself is to own real assets... because that’s the only thing which will protect you as currencies debase.”

The two highlighted areas are both ideas I have talked about and agree wholeheartedly with. First the market and the world have no idea of how this will play out, how bad it could be (which can still be a great opportunity for us) because as I have pointed out time after time, the world has never been so connected, global economies have never been so inter-dependent and the CB QE policies with nearly 600 cuts around the world since 2008 are simply unprecedented. There's no precedent we can look to to try to understand what's ahead of us and the one thing we usually lack is imagination and the ability to think in unreasonable terms as that is the way the market typically acts, we come up with what we think are reasonable targets and they are always blown away.

The Second, is something I do believe in, although I think with an edge trading can be very lucrative, but real, tangible assets. Rental housing would be one, but I think BlackRock and other major players in this area are about to unwind their positions (as they simply aren't making what they projected) so that's one that may be great in the futures, but I wouldn't want to mess with it now.

Not that this is a market story, more of a Human Interest, but I thought it was interesting that Reuters reported that the first AA Prez who visited S. Africa this weekend to celebrate the life of the terminally ill, Nelson Mandela, didn't receive quite the open arm greeting one might imagine, in fact police had to use Stun Grenades against protestors that weren't happy with our foreign policy, especially the "D" from above strikes.

Then as you know, I've asked and written two articles both linked on the member's site, whether the Bank on Japan lost control with the Godzilla of all QE's, doubling the monetary base in two years as a part of Abe-enomics.

It seems Eric Sprott had a similar question, but a lot closer to home...


"Recent comments by the Federal Reserve Chairman Ben Bernanke have shocked the world financial markets. It all started on May 22nd, 2013, at a Testimony to the US Congress Joint Economic Committee, where he first hinted at tapering the Fed’s quantitative easing (QE) program. Then, on Wednesday, June 19th, during the press conference following the FOMC meeting, the Chairman outlined the Fed’s exit strategy from QE.

The chaotic reaction by market participants and the corresponding increase in yields now risks destabilizing this very fragile equilibrium. It is yet unclear whether or not the damage control from the other Fed Presidents will put a lid on yields and market volatility, or if the damage to the Fed’s (poorly executed) exit strategy is permanent."


Now as for what we can see with regard to what's right in front of us and what we might find to be overwhelming probabilities.

As for what Technical Traders see, from the 6/18 failed breakout of the SPX triangle (roughly 5/24-6/15) which they would have expected to break out to the upside and which Technical Analysis Dogma calls for a reversal of positions (from long to short) on the failed breakout. As for what technical traders see, first a rejection of prices at the SPX's base that it created from 6/20 to 6/26 with another "seemingly" failed breakout on 6/27 as the market hit overhead resistance.

They also see a 61.8 Fibonacci retracement from the 6/18 to 6/24 move.

They also see the SPX reject resistance perfectly at the 6//27 intraday highs at the 50-day moving average (with a closing candle with a longer upper wick-bearish). They also see the 1- and 20-day moving averages rejected and act as resistance Thursday. These are all basic tenants of Technical Analysis, they use to work pretty well before the year 2000 when everyone came rushing in to technical analysis, but since have been used more and more as ways to use technical analysis against traders.

Friday it initially looked like we'd break down and see the downside move reflected in the charts short term on Thursday, from the continuos ES trade perspective, we did in fact see such a breakdown as we came off the highs of the week overnight and opened to a much lower level, but from the average's perspective, Friday (until the close), did not look like the pullback I saw hints of Thursday, it looked like a day that was pegged for an options expiration pin as I said Friday. 

So in my view, the downside move I saw 3C telegraphing Thursday, has not been fulfilled, in fact until late Friday, I wouldn't even say it started.

Very short term here are some of the negatives still suggesting we haven't seen the start of the downside move that showed up in Thursday's charts yet.

Candlesticks and Resistance beyond the areas I already mentioned above.


Anyone versed in the basics of candlesticks would look at this move (strongest 3-day move of the year or not) and see the candles on the move up as having very small bodies (not bullish), Thursday would have been a larger resistance zone of the actual triangle in addition to all the other very obvious ones mentioned above and most importantly, retail traders typically won't take a position until they have price confirmation first. Thursday set up an Evening Doji-Star reversal candle with a long upper wick, almost long enough to be considered a "Shooting Star" so the downside reversal signal was there (candlestick reversals really have to targets beyond the immediate future unless you are seeing the same pattern on a 5-day chart, then it obviously has bigger implications). The confirmation they'd need would be a close lower the next day which we saw Friday, this would be what retail shorts need to enter and the more confirmation, the more confidence they have. We already know from sentiment updates that retail was WILDLY bearish Friday, so the charts are giving them what they want, I believe Wall St. (to get what it ultimately wants) will give them what they want to see as well and retail WILL chase prices lower unlike us.

The candlestick chart taken with any of the other resistance areas I mentioned above would be a very tasty technical short set up (for retail).

Some of the Leading Indicators short term also are in line with a very near term expected move down (I try to set some expectations ahead of time so people don't panic, as I said last week, when I say "Pullback", I don't mean a little dip, this market is way too volatile for that and moves need to be SOLD, they need to be convincing).

***Leading Indicators are always compared to the SPX (green) unless otherwise noted***

HYG, High Yield Corporate Credit which is a SPY arbitrage asset (meaning it goes down and it has a very powerful pull on arbitrage players to sell the market) was in line Thursday, but fell out with the SPX Friday suggesting a near term move lower for both or at least the SPX.

 The very illiquid High Yield Credit shows some negative divergence with the SPX on Friday at intraday highs, but I would draw your attention to the fact they are relatively mold as the liquidity in HY credit is so low, it is usually one of the first to panic and panic big which it is not doing here- translation, I'd expect the chart to signal a near term move to the downside. but it seems smart money is not worried about that move to the downside right now.


 Commodities have not been supportive in large part during most of this move, this can't be taken as near term bullish.

Yields near term have clearly deteriorated and moved to lower lows as the market moved up, they "should " move together, but when there's a dislocation like this, Yields tend to pull the
SPX toward them like a magnet, again suggesting near term downside.

 Currencies (not that they have been that influential - at least these two) have really lost any near term market support as the $AUD above gave out Friday in a pretty big way after supporting the move up earlier in the week.

 The Euro, well it is what it is...

FCT as a sentiment indicator has given out vs the SPX, again the caveat would be it hasn't put in a severe divergence and very clear sentiment shift, the chart's implication being that the short term expected move is down, but again they seem to know something beyond this move that hasn't spooked them, for instance, that a large move to the upside is probable after the near term decline which may in fact look very bad, but to those in the know, the move following it to the upside would be much stronger and the relative performance of each can't be known by us until after it is done, but again, that is what this chart suggests.

HIO is similar, it doesn't look that concerned at all.

TLT (20+ year Treasuries) are in line at the green arrow, moving up in near term concern at the yellow and moving up as the SPX see an EOD Friday nasty close.

Futures...
ES 15 min shows a clear in line move on the way up, starts to see distribution and now is leading negative. I've noticed that since volatility has picked up a 15 min chart that might have represented say a 2 % 3 or 4-day move can now represent a 2% 1 or 2-day move, meaning the move up or down is still similar, but the timeframes are now much more compressed so don't be too quick to apply methods to these charts that were appropriate in a totally different market climate.

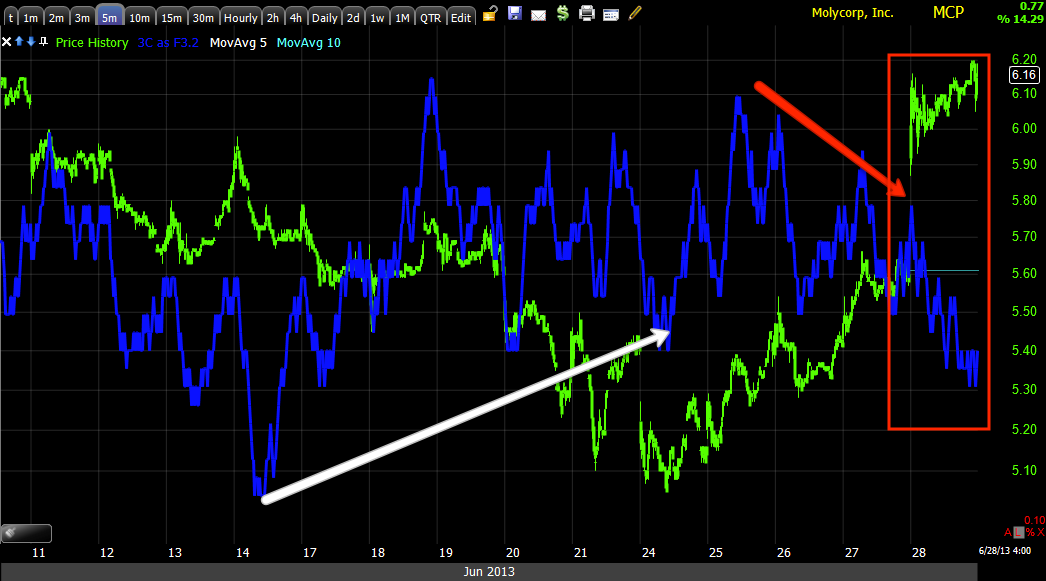
As an example from the averages, the IWM...
 IWM 3 min with a large positive and a negative in to Thursday/Friday

IWM 10 min with another large positive (meaning I think large enough that it has plenty more room to move to the upside once the near term trade is taken care of) with a negative relative divergence Thurs/Fri.

The Dominant Price/Volume Relationship for all 4 major averages on Friday was "Price Up/Volume Down) which is the most bearish of the 4 possibilities and it was as I said, Dominant. This is not how the averages themselves closed, but how all of the component stocks making up each average closed, we look for dominant relationships among the 4 possibilities and among all the averages. The relationship most often serves as at least a 1-day overbought condition (whether truly overbought or not) and almost always shows a close lower the next day and Monday opens tend to be extra volatile.

OK, I think that's pretty much enough to make the point, I could go on and on, but I think we get it.

Now to look at the other side...

First Leading Indicators....
 Commodities themselves I don't think can be taken as a bearish signal as they are just acting the way they are supposed to vs the $USD as seen above.

I showed you a very zoomed in view of the low-liquitity High Yield Credit, but looking at the normal view, this often "much more panicky asset) is sitting right in line as if it doesn't care what happens the next few days, someone apparently is not willing to part with the shares right now.


 HYG Credit which would have to move for the SPX to pullback because of its arbitrage status, doesn't look at all like it's worried about any moves lower (not to say they won't come), the 30 min chart has a huge positive divergence.

For that matter...
 So does High Yield Credit (3o min)

And Junk Credit, 30 min. *If the credit leads the market and we were able to get the best 3-day move of 2013 with barely any of the positive base here used, imagine the possible upside. It seems someone (and only institutional money trades Credit like this) is expecting something big on the upside very soon, this is why I'm not too concerned about any pullback.

Yields I showed you were near term, but in the trend they are still well above the SPX so it seems the SPX at some point in the very near future (I'm guessing some point this week) owes quite a bit of upside before regression to the mean is reached. The move last week didn't even get us half  way there and these always tend to overshoot.

The ES 2 hour chart has stayed very positive on an extremely long timeframe.

The NQ 1 hour is also very positive, these timeframes almost don't care what a 15 min chart does, they are in such a different class.

And TF futures 1 hour as well.

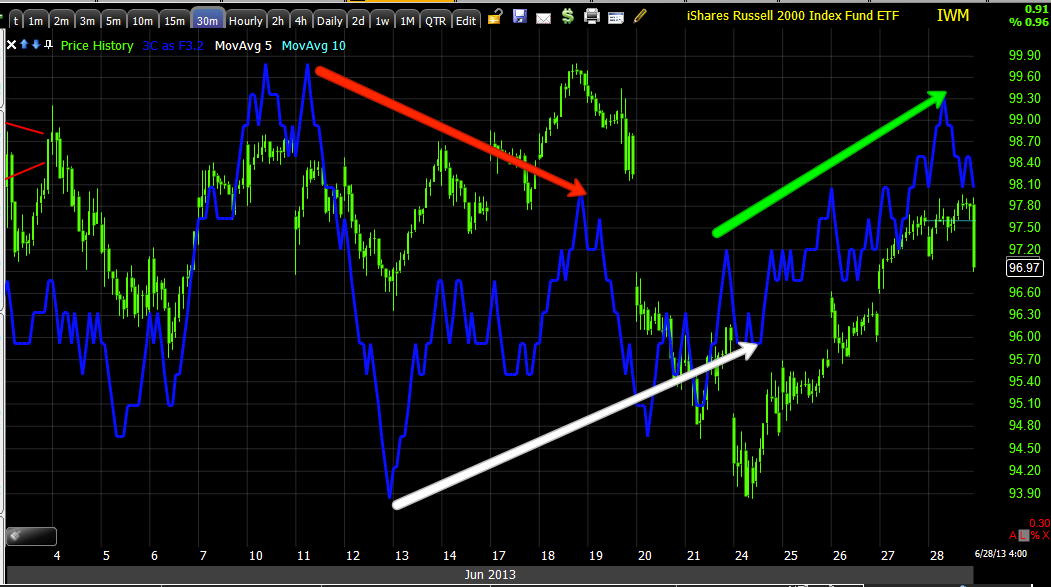
And our IWM example...
 The 30 min has a large positive with a lot more gas in the tank that is perfectly in line

As does the 60 min.

I think this is probably enough to flesh out the picture I'm seeing as of now and this is pretty much no different than what we started to expect Wednesday and pretty clearly by Thursday. I didn't want to get too involved in too many short term positions when we are getting closer to the real prize (I don't want the distraction), but this is the reason I closed a number of short term long positions Friday and Thursday and entered some short term UVXY Calls (expecting a near term decline).

***I also have some pretty good expectations for the gold and silver call/long positions, I'm guessing the miners too. Take a look at the Silver and Gold Futures, the short term charts look good too.

 Silver 15 min looks ready to go, same as the ES 15 min chart (different direction) so I think we see some nice action this week.

Silver 390 min looks great as far as what's in the tank.

 Gold 30 min, the silver 15 min should launch both at the same time, that's impressive.

And the gold 60 min. It really looks like someone has been stocking up for a big move here.

I don't know exactly how all of this fits, but... I think the extremes in the charts above and the data below may make for an extreme that does well by our long positions.


 COMEX Gross Gold Shorts at record All Time Highs!


Comex Net gold longs at the lowest for a decade.


And... COMEX gold inventory at lows not seen since 2008.

Sounds like an interesting week for gold and silver.

Well that will do it for now, I'll check in on the a.m. futures, I wish everyone a happy, healthy , safe and profitable week ahead.


Friday, June 28, 2013

The Week Behind, The Week Ahead

Well we were right on the base, the market move which wasn't just a bounce,m but the best 3-day move in the market the entirety of 2013 while everyone was as bearish as could be. We even got the specific catalyst that would spark the market correct, but this was a small opportunity, on a scale of 1-10, maybe a 3. I believe before this move is over we'l have about a 5 and the next opportunity that this move sets up (have you noticed how one move in the market sets up the next?) will likely be a 10, the kind of move that we may only see once in a lifetime.

I'll be addressing the week behind us because the market doesn't do anything randomly, random events sometimes effect the market such as the large banking sector liquidity CRISIS in China this week that seems to be the reason gold and silver were slapped around when they were otherwise ready to rally. Just look at the Precious Metals right on the Chinese market open, the Chinese banks that can't find any liquidity just like the US financial crisis that brought down Lehman, a company around nearly a century, are selling assets to raise capital and one of their largest holdings at a gain is gold and silver. If they don't raise liquidity, they could be the next Lehman and the normal channels (other banks on overnight loans) are shut down, just like Lehman because in an opaque market such as the US financial system in 2008, the counter-party risk was too large, in other words you didn't know if the bank you were lending to was a Lehman or not. Now just imagine how much more opaque China is, so yes, sometimes there are surprise events that the market has to discount on the spot as they were not anticipated by the market.

The week behind will lead to the week ahead and what to expect.

I'll address the amazing call (amazing not because it was right, but because it was true, it actually happened) of the F_E_D somehow being the catalyst and an amazing (6) F_E_D speakers this week, each with their own job to do to control the market; the first 3 created the strong 3-day rally, the 4th and 5th created the draw-down (semi-pullback today as we expected yesterday) which could have been for several reasons from the op-ex pin to creating an actual pullback.

The final speaker of the week gave the market the same message the first three F_E_D speakers gave the market.

Can you honestly say you think this was coincidence? The fact we had so many F_E_D speakers, the fact that the 3 Hawks all came out with the same message which was extremely uncharacteristic and on the day they needed the market to at least consolidate for at least an op-ex pin (there were two speakers right in time for the market to do what was needed today-again both sharing the same message and one of them was from earlier in the week now giving the opposite message). Clearly the number of speakers, the clusters they were in and timing and messages they carried at the time was what was needed, when something else was needed as we saw the underlying trade YESTERDAY suggesting at minimum an op-ex pin and more likely a pullback to come,  what exactly are the chances that we have two additional speakers  (one of which was almost contradicting himself from earlier statements in the week) and they were right in time (just before the market open) to create the price move needed?

Do you believe in coincidences like this in the market?

Look at it this way, you know we were already expecting a strong move to the upside well before the start of this week (and I mean even stronger than the strongest 3-day rally in all of 2013 that we saw this week), the signals were already in, we just needed some catalyst to serve as a spark and to give Financial media an excuse to give the masses who want to understand the market rather than make money in it.
 When the market was set up (the right size base and accumulation were in place) for a move to the upside at the start of the new week, we just so happen to have 3 F_E_D speakers to give the market the only message it cares about right now, and to make it more believable, they use 3 of the biggest hawks who have opposed the VERY message they delivered.

And as you know we had signals yesterday that suggested the market at least holds for an Options Expiration pin, if not a decent pullback and more likely BOTH....
Right after ES (The S&P E-mini Futures) makes the high for the week and between 15 and 90 minutes before the market opens, we have a cluster of 2 F_E_D speakers just before the open to make sure the above happens, or in more detail...

 This is overnight trade with ES building on Thursday's close and moving ES to an overnight (3 a.m.) high of the week, setting the market up for a 4th day of gains, but we already knew that couldn't happen from the 3C signals Thursday...


So at 8 a.m. and 9:15 before the market opens, two F_E_D speakers (one who already spoke earlier in the week to pump the market) give the opposite message from earlier in the week so the market looks like this in to the open...

What are the chances that we have 6 speakers, 3 who are known hawks come and say exactly what the market needed to hear, but only after the 4-day base we predicted last week was built and the 3C accumulation was in place and then we see distribution signals Thursday and futures make a new high for the week overnight to add to the already record 3-day move for the year, which we already knew Thursday couldn't be allowed to happen as distribution was already set in motion. So what are the chances that those two speakers contradict what the other three said earlier in the week (AGAIN WITH ONE OF THEM CONTRADICTING HIS OWN MESSAGE FROM EARLIER IN THE WEEK) to once again give the market EXACTLY what it needed?

Coincidence? Coincidence that I could have predicted it over the weekend? 

You can make up your own minds, but from the way I've seen mini market cycles set up days and weeks in advance and how they lead to larger cycles that have been set up months in advance take place and how we were able to use that information to make winning trades that placed us in the top 1/10th of 1 % of all portfolios, I can't imagine that is coincidence.

So this weekend, I'll show you the signs and signals in place for our next round of, "Random Market Walk".


MCP P/L Equity Long

 MCP  has been a position we've had interest in for some time. We did however have a MCP "New Position or Add-to" alert on 6/21

The alert came out right where the white arrow is on this 30 min chart.

Around 11:10 this morning the MCP July $5 calls were closed in this post, "MCP Position Management" I said I'd be closing the calls as I didn't see any further momentum that would add to their value short term, but since the equity position doesn't rely on volatility, time decay, etc. I also said in that post that I'd leave the equity long position open.

The fill for the July $5 calls was just over a +25% gain.

Later in the day at 3:36 I posted, that I'd be taking at least half of the long equity position off the table this turned out to be the intraday highs of the day and this is the P/L for the equity position below...


At the $6.17 fill, the P/L for the equity MCP position came to +8.25%.

I love MCP and look forward to re-entering the position.

When traders chose positions, they get it all backwards, they pick the stock and then they hope the market cooperates with their position.

The greatest force moving the majority of stocks on any given day is the market, the second largest force (typically and more specifically in a healthy-non-manipulated environment in which Sector Rotation is active) is obviously Sectors in or out of rotation and finally, believe it or not, the least influential (of course with obvious caveats) is the stock itself. In our case this is not as true because we can see where extraordinary events are occurring such as in MCP.

In any case, closing MCP right now has a lot more to do with general very near term market conditions than the stock itself.

As I was saying, I love MCP and beyond the typical "Move with the market" assets, there are a few out there that have their own legs and will either buck the market's trend or they will trade directionally with the market, but have much better relative performance.

I'll post MCP charts as well so you can see why I'd like to re-enter MCP at more favorable prices.


 This is the MCP 3-min intraday 3C signal going from accumulation to price / 3C trend confirmation to a negative intraday divergence  today, especially toward the close. I ended up closing the entire position.

 The 5 min chart makes the accumulation period very clear, it also makes clear that the size of the accumulation period is more than enough to support a move higher, however the EOD negative divergence suggested that MCP would see a pullback in the near term and I decided, rather than hold MCP through draw down in a very volatile and unpredictable period, I'd rather not have MCP acting as "Opportunity cost for the roughly $10k position size when those funds could be better utilized short term or at least are safe off the table.


The 10 min MCP chart shows distribution at the two parabolic-like spikes in May and accumulation in MCP starting earlier in June.

Remember how I said wherever the divergence first starts, even with lower prices as this is the way institutional money has to accumulate because of their position sizes,  in my many years of 3C experience I've noted that the eventual reversal from accumulation will exceed the level in which accumulation was first noticed. Well that happened again (this is the 3rd example in the last few days), thus as long as the signal stays solid, I have faith in the indicator.

Again the size of the base here and I could make a case for an even larger base, is more than enough to make a much higher move as we expect generally and specifically with MCP as it has legs of its own outside of market correlation.

So I'll be looking for a lower price area with confirmed 3C accumulation of the pullback (which should be at least a fill of today's gap)  to re-open at least the equity longs and perhaps the call position if the environment is favorable.

GLD / SLV

I don't have any really good signals that suggest either should be closed so I'm leaving them as is.

I don't like the idea of ever chasing an asset, but especially not one that's up 2.5 to 5.5% today. That's me.

Closing NUGT Long Equity Position

I'd like to re-open it, but for now I think the signals are on the side of closing it near term

Taking at Least Half of MCP off the Table (Equity long)

VXX/ UVXY Positions (Long)

You already know I took a call in UVXY meaning I do expect a pretty serious pullback, there's no point in doing these things if they aren't effective and to be effective they need to create Fear, Greed and HOPE.

 VXX 2 min


3 min

5 min

10 min


30 min

This still looks very much like the market movement expected yesterday, pullback and finish a very strong upside move.

Closest thing to a market update

The general gist: There are a lot of short term hum-drum signals, I could take them to mean the pullback is coming starting today at the close or that we could see some more fooling around in this area before a pullback. 

Overall if you want to play it safer (note I only took 1 pullback position, the UVXY call), I might skip trying to trade the pullback and keep your eye on the first prize to the upside which unlocks the final prize.

NOW...

First let me say that the biggest mover of the market I think will be the 3:30 F_E_D speech.

I also do not consider today to be a pullback, it started looking that way early, but in my opinion today has been nothing more than an op-ex pin.

Furthermore, when I say pullback in this environment, I don't mean a little dip and then everything is happy again, this is meant to scare the hell out of any long and make all shorts feel like geniuses.


First Index Futures look to me like there's still a decent pullback coming, we really haven't had much more than an op-ex pin today. However that said, the long charts 30-60  and even 2 hour all are still on board with a bigger move to the upside.

HYG is underperforming the SPX today, also 3C charts say to me the pullback is not only not done, it really hasn't even started yet, but the longer trend expected still has HYG on board.

High Yield is in line, I'd say it will move, but the fact that it is not panicked alone suggests to me they know what's coming (the upside move).

Commodities are broadly not supportive, but not in a huge way, but this time they don't have the $USD to blame completely.

Sentiment indicators are either in line or in the case of FCT, dragging, they are expecting some downside, but they aren't panicked by any means, suggesting to me they still believe in a very strong move after a pullback.

Niether the Aussie or the Euro are near term supportive, just the opposite in fact.

Yields have even given up ground, long term (as in the final up move we expect) they are still in the right place, shorter term as in intraday and day to day over the next couple/several days, they have moved to a position in which they'd exert downside magnetism on the market.

Overall if you want to play it safer (note I only took 1 pullback position, the UVXY call), I might skip trying to trade the pullback and keep your eye on the first prize to the upside which unlocks the final prize.


Full AAPL Update

Or at least as full as I can offer during the trading day.

This is why AAPL is one of the few bounce trades (meaning unlike UNG which I think will be a primary bull position over the next year, whereas AAPL will still be a primary bear position, but has a better bounce than most other assets we have call options in) that I not only have July Calls in and I think they'll be fine, but also one that has enough upside potential to also have a long equity (no leverage) position as well, which is better served for the longer trend than the call.

The reason why? I don't think AAPL is a bounce, I think its a counter trend rally (and these are the strongest rallies you'll see in the market).

AS far as today, remember what I said at the start of the week, this is the end of Q2 and there's going to be window dressing (The Institutional/ Hedge Fund "Art of Looking Smart"). I also said Thursday (yesterday) was the last day for trades to be made and show up in the new prospectus, client report. Even though the end of the quarter isn't until today, the T+3 (Trade plus 3 days) settlement rule would make yesterday the last day to move positions  and since AAOL has lost 8% this quarter, 28% this year and about 45% since its highs last year, I'd think most managers wouldn't want AAPL showing up as a current holding, but if it were me, as soon as the last day is over (yesterday), I'd buy AAPL back and clients wouldn't know about it until the end of the next quarter (with some obvious caveats).

This is why I think AAPL didn't participate this week and why AAPL looks a bit different today than the rest of the week.

This is a chart I drew some time ago, I didn't even remember it until I stumbled on the layout. What I was showing you was the change in character from a downtrend to a lateral trend which is most often a base. Then what looks like a large bull flag, because of the triangle and the probability of a base under construction, the obvious assumption would be Technical traders would see a head fake and the triangle would see a downside break instead of the upside break the technical pattern suggests, another example of Technical Analysis being used against technical traders.

 Just from a "feel" perspective, with a 45% loss under its arm, this looks and feels like the right area for a counter-trend rally, not a trend reversal, but a rally that makes people believe that. 

The Crash of 1929 and bear market that followed saw 5 counter-trend rallies , the first one started 3 months after the crash started and ultimately moved +50%over 5 months, how many people do you think bought in to the move as being a real, renewed uptrend? I'd say 95%.

 This is my X-over screen to avoid false X-overs and to manage trades, pullback expectations, etc.  Since 2009, the indicators all stayed long, RSI gave a hint at the top, but they would have kept you in for the majority of the gain.

The confirmed signal down is still in effect and may stay in effect even with a counter trend rally. So far the Price window has given a long signal, the other two (custom indicator and RSI below) have stayed in a "non-confirmation" mode for the price window X-over.

 My Trend Channel would have kept you long until the decline from the highs to $610, but that's the majority of the trend. Note the change in character with the increased upside move in yellow, this is always a warning the trend is about to end. The current short stop would be $465. I think we could see that level.

 My long term 3C is clearly negative, as far as I'm concerned, counter-trend rally or not, AAPL is a long term bear and when its in the right position, I'll reopen the short.

My MACD Heat Map takes some explaining, but it did suggest a bounce/rally was coming as well as calling the top.

The 1 min 3C and volume saw one of the larger volume moves this morning, head fake moves, even on a 1 min timeframe (fractal nature of the market) are there for a purpose. Please read my two articles on Head fake moves to understand why.

 The 3 min 3C shows stronger than usual accumulation and right at the area of large volume this morning.

The 5 min chart, note how strong the leading positive divergence is in general, but especially today.

 Even the 10 min 3C saw an increased 3C move today.


 The 15 min positive trend, this shows a large base, a lot of accumulation and a move that has so much upside potential, it can only be a counter-trend rally, no bounce has this much support from 3C.

Despite two triangles that should have produced large volume for institutional money to accumulate, in the end it was the psychological $400 level that had the largest volume.

The overall 30 min. Note the positive divergence in to the bottom at "A" and how much bigger the current leading positive divergence is at "B" so I'd expect a move much stronger than the one that started at "A".

While I don't want to chase any asset, I think AAPL is still a good add to or new position right here, that even counts for options, although longer dat