Wednesday, June 5, 2013

Added Positions

UNG Long Equity
UPRO Long Equity
IWM June $96 Calls

Also Like UNG Long Here

Positions

I'm going to try to get these out ASAP, in bold are positions I'm going to take if I have the time, from what I looked at, this is what I like.

XLK long calls or TECL for an equity position
XLF long calls or FAS for equity long
DIA looks good, I prefer it over UDOW long equity
AMZN long calls or equity
GOOG long calls or equity
SPY calls or UPRO equity long
IWM calls or URTY equity long
GS long calls

Market Update-I'll Probably Look for Some Last Minute Positions

I'm nearly convinced now of a couple of things, 1) the inverse H&S was purposefully taken out for the reasons I cited, 2) that is market makers accumulating 3) There has been no or almost no institutional selling today, which brings back to all of those charts that all had the same stronger leading positive today, which makes me want to look around and see what I might get before the open tomorrow.

 First CONTEXT's model for ES says ES (SPX futures) are about 12 points undervalue - remember that-risk assets.

HIO as a sentiment indicator is showing very little fear through mid morning and the rest of the day.

FCT is showing even less as it moves up.

This is really interesting because the Yen/SPX correlation has been nearly perfect, 1.0, but here the Yen makes a lower high and the SPX makes a lower low-that's not the correlation, but that is the EXACT time that inverse H&S bottom I was worried about was taken off the chart.

Yields are a magnet for equities, that's a move above the triangle as we have expected.

Remember other assets, this is High Yield Credit, the very illiquid kind, HYG I understand can't move or it screws up the arbitrage, but this is not part of the arb, if HY credit is being bought as thin as it is, someone on the institutional side os pretty darn confident of a good move to the upside.

 ES continues to make new leading highs and we know it's not retail, I'm almost sure that would be middle men.

 TF and NQ are doing the same...


Here's another Doozy...
ES hasn't moved toward VWAP once today, if you are a market maker or specialist filling orders, you wouldn't keep your job selling below VWAP, but you would be very interested in buying at the lower SD of VWAP, that's exactly where institutional money buys or the middle men fill for them.

That's a lot of smoking guns.

I'd bet this is middle man accumulation

By middle man I mean market makers on the NASDAQ or Specialist on the NYSE, a lot of HFTs are so fast that they act as middleman too, but they have no legal responsibility to provide liquidity at market like the other two so they can actually do more damage as these middle men are there to keep an orderly market and get certain perks for doing so.

In any case, retail doesn't act like this, institutional is already in, this is the timeframe middle men work in and they move very late when you see them, how do they know? Because they've been filling the institutional orders, they know what's going on.

 The accumulation is larger and larger and in a range-the hallmark of pros filling at a VWAP or other specified target, the lows of the day work nicely.

The same is going on in Futures.

I don't usually bet on big gaps in the a.m., but this is one of the few times I'd lean toward that more than anything else, it would also be the most effective short squeeze

Sentiment

Whatever it was, planned or not (and the reason I say this is market makers and specialists will load up before a move, they need the inventory to make money so it's more than a little strange, but it worked from some Tweets representative of sentiment...

From Sam (Thanks again)...


well that worked, bears are emboldened

Here are the latest tweets:

"woow this is more extended than i thought $SPX"

" tankage continues with volume (still holding rest of the short positions)"

"1586ish good to have on radar"

I see tweets all the time proving they have no concept of "big money"

It seems most if it not all misunderstand the inner workings of "big money".  Traders seem to think volume spikes are them taking positions and don't realize the time it takes them to take a position, here is one tweet among dozens I see everyday:

"i dont think big $$$ is stepping in front of this freight train . they will wait for the leak of numbers on friday".

Sam is 100% correct, this is the biggest fallacy of smart money taking positions, "The volume spike".

I can give you 100 different reasons why and usually do, but one of the most deadly is the Predatory HFTs that feed off institutional orders and because of their speed, front run them. Funds will break up big orders in to small ones and try to fill at VWAP, if they put an order that large out, the HFTs that look for the small orders called "Pinging for icebergs" so they know a large order is being ffilled and front run those. The net result is smart money would not only drive prices against themselves as the order goes through the bid/ask stack, but HFTs would be in front of them selling to them at worse and worse prices.

Almost Forgot

We have it in ES (SPX Futures) too, maybe even better as well as TF and NQ, but ES is the best example.

 There's a much larger positive in ES that I don't have the history to show you, but the pint is the recent move, it didn't send ES negative at all, in fact it made a new leading positive high, so that's good, but from a short's perspective, this is what they see.

There's nothing there that would cause me to cover if I was using the same T.A. I was using 10 years ago.

So it seems to actually work out better, whether it was planned or not, I can't say, it does seem a little strange to have a stronger leading positive divergence in an timeframe that market makers load up in, we know it's not retail...

Market Update

So far we're ok...

 We're not falling apart at all in the early timeframes, actually at a new leading positive high so that's good.

The DIA is an example of reaching out to the Institutional timeframes

This 30 min chart of the DIA is one of those that I'd call, "Hard to ignore", meaning when I see something like this I very rarely pass it up.

And the Q's right in between the DIA at 10 min is holding together.

However, as you know new divergences start on the earliest timeframe, it seems like we have a new player for this afternoon.

With 3C, if there's a positive that we end the day with, we usually pick up the next morning on that positive, the same goes for a negative, for instance we close with a negative on intraday 1-2 min, we may have a gap up and it will fade from that divergence from the previous close, it doesn't work like that with futures, but interestingly it does with FX ETFs even though they have all night to trade, somehow by the morning, they find their way back to continue from the closing divergence, I'd call it foreknowledge which you can only have if you are running the game.

In any case, it's interesting and it doesn't ruin the short squeeze as it makes the inverse H&S disappear in to what just looks like a downtrend.
 DIA 1 min at the low that destroyed the Inverse H&S pattern with a leading positive.

The Q's the same, even bigger.

Same with the IWM.

The SPY shows it at 2 min.

In any case, the Inverse H&S is no longer standing out, it is a failed pattern as far as the bears are concerned which, if we get the gap up, is the best psychological and short squeeze outcome.

I'm going to check Bellwethers and Leading Indicators.

Quick Screen Captures on the INV H&S

This is what the price pattern looked like at 2:05 just after the Beige Book came out, this I didn't like...
 Whether it's a real Inverse H&S or not (volume confirms), it doesn't matter because retail never confirms them with volume so they would take it as a threat to their shorts and cover here without causing too much of a mess.

This is what it looks like now, which believe it or not, I actually prefer, now it looks like a failed pattern, it emboldens the shorts.

Our ideal reversal is "V" shaped, we don't get many of those, but a gap up in the morning in even better and we would have the overnight session to put the process in.

What is important is that signals like this stay strong. (SPY)

F_E_D's Beige Book

The release at 2 p.m. has a lot of "moderate" or lukewarm language.


  • *FED: BEIGE BOOK BASED ON INFORMATION GOTTEN ON OR BEFORE MAY 24
  • *FED SAYS GROWTH WAS `MODEST TO MODERATE' ACROSS MOST OF U.S.
  • *FED: HOUSING INCREASED AT `MODERATE TO STRONG PACE' ACROSS U.S.
That last one is a doozy, from Mortgage applications and lumber futures, we all know housing is about to collapse, the only thing holding it up so far is the fact that BlackRock hasn't joined many of its peers in liquidating its real estate portfolio (rentals).

In any case, I'm waiting for my Screen Capture to reload. 

There's a large inverse H&S price pattern and real or not (confirmed by volume), it is NOT what I want to see as it will send more shorts covering too early. So a little downdraft in to the afternoon is fine with me AS LONG AS WE GET SOMETHING LIKE A GAP UP IN THE A.M.

The point is, the shorts are the rocket fuel, their covering is the burning of that fuel, we want it in one big blast, not in little steps here and there.

So I'm going to check the 3C charts and make sure everything looks right, but at this point I'd rather see that Inverse H&S in the SPY be discredited than gain some upside from here, when looking at the picture and the anticipated move above the triangle, I don't mind waiting until the morning if it's going to fire off a lot stronger.

I'll take a look around, as soon as the screen capture is reloaded I'll put up some posts, but so far we have some soaring positives and that Inverse H&S in the SPY looks good to me at this point because shorts are going to look at it and say, "Ah, there's a failed bottom", which keeps them in.

Ideally we gap up in the a.m. and force them to try to all fit through the same small door all at once.


VIX Futures Can Still be Traded

I personally want to pick up options while they have momentum, for instance for a call I want the underlying stock to have downside momentum, no one wants to buy calls at a time like that, that's when I want to buy them IF I have reason to.

I want to sell in to momentum as well, this time as it is moving up, usually at the first hint momentum is slowing as profits start dissipating as momentum slows, even if you have a strong momentum move early and sell there and then you have a weak move higher, even though the call or underlying is higher, most of the time your profits will be significantly lower because options are priced on a model that takes different things in to consideration, it's nothing like stocks.

In any case, for me, in most cases the time to get in to options was earlier when it is the hardest, but stocks and ETFs (esp. leveraged) can still make decent trades.

Take VXX (and I'll show you that same concept from earlier AGAIN).
 In a post 1 or 2 back I showed you VXX and how it gave the exact same signal as a lot of different assets that are vastly different (financials, market averages, volatility, treasuries). Here it is again, the point being the negative divergence with a head fake move which is out timing signal, already in place.

I wouldn't take out puts here in volatility right now any way, but if I were to, it would be while they had upside momentum and I had this 3C signal.

 However XIV which is the inverse/opposite of VXX can be traded long, but more interestingly look how it too gives the exact same signal just like the SPY and all the other assets, I included the SPY below so you can see.

In any case, prices are still good here although it didn't make a new low like I'd prefer to see. 
The SPY giving the same signal, all 3 assets that are very different in leverage, in management companies, in asset grouping are all showing the same thing, that's a find on a day like today, that's why I call 3C as I do, "Compare, compare, compare"


Market Update...

There's so much going on right now that I can't possibly show you every thing.

First the weakest hands among the shorts just covered, this is what we need, I know today was hard to sit through, these moves have to be convincing to get the shorts in, and as a matter of fact, from our sentiment update...


"BIGGEST BULL on twitter no longer bullish"


Most of this is all emotion, not fact based.

Remember the divergence I showed in XLF, FAS, SPY, DIA, etc.

Here's some more in totally different assets, you'll have to view them inversely as the trade opposite the market, but they are the SAME EXACT SIGNAL and in VXX and TLT no less!

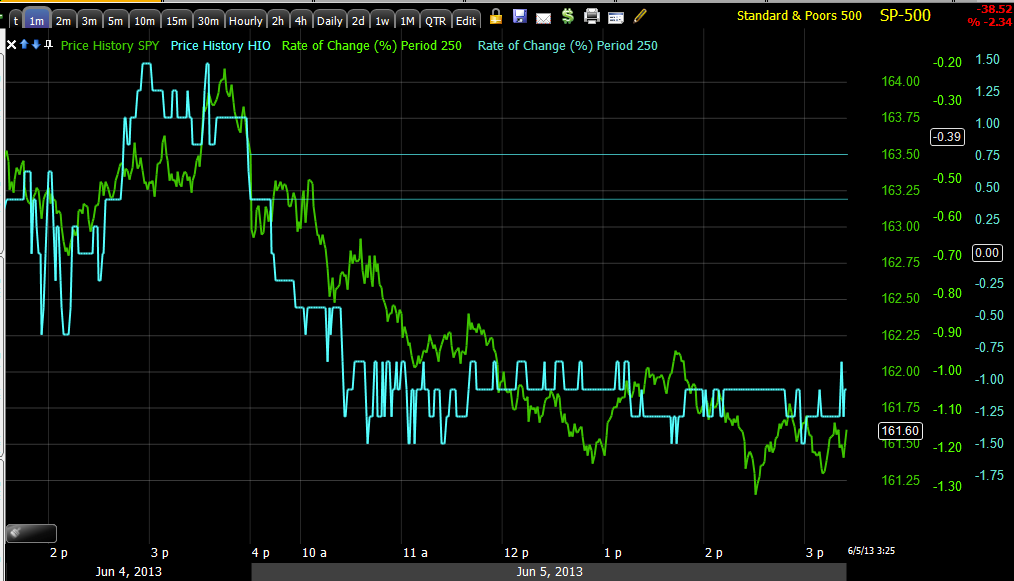
 This was the SPY example of the leading positive divergence on a break below support, the same concept still applies, No significant reversal will take place without a head fake move first", today's was emotional, but emotions aren't what we base decisions on and in the end it helps our short term longs more.

 VXX is giving the EXACT same signal as the SPY and all the other assets, it just trades mirror opposite the SPY, so as I said, I've seen these everywhere today and it is just such a thing that we want to find, we want to see what the crowd missed".

 TLT also trades opposite the SPY, the same as VXX most of the time, it has the same exact signal today, these are confirmations that the move is a head fake, otherwise it would be really hard for me to open call positions.

ES has gone to a FLYING leading positive divergence, it's even higher right now.

This looks like weak handed shorts covered on a little panic.

That's a higher high, the fact it was only pennies above the former tells me they had limit orders in which Wall St. can see, I never use them.

The USD/JPY is making its move which is what we need.

It looks like we have our start.


What the Heck... After looking at the Rest of the Financial ETFs, I'll take a shot on a call with all of this momentum

XLF in the money-June Monthly.

FAS- XLF

One of the ways to get confirmation of underlying trade is to look at correlated, but entirely different assets, for instance FAS (3x long Financials) price movement is correlated to XLF, but it's an entirely different ETF, it's leveraged, it's a different management company and it trades completely different volume, so these make for good confirmation assets.

Take a look at FAS and what it shares with XLF, the SPY, DIA, QQQ, and on and on...
 Not only does it have the normal progression of accumulation from a relative divergence to a leading divergence, but it has the head fake move which is below yesterday's support and the exact same leading positive divergence through the entire move today.

As a matter of fact, another leveraged Financial long ETF, UYG from another company...
UYG from ProShares.

I don't mean to suggest this is just in Financials. I'm just using it as an example, it's the common thread today, that's what you are looking for, the thing that sticks out, that which the crowd missed.


XLF looks Really Interesting Here Too, Shares a Common Thread With Many Assets Today

Here's XLF-Financials

 Note the leading positive divergence, this is what tells us if a move is likely a head fake or not. I like XLF for a lot of other charts as well here for a spec call position only.

This pattern I have seen so many times today I can't post all of them

The SPY with the same

The DIA with the same

The Q's have the same and a number of stocks as well.

Went with XLK June 31 Calls

TECS P/L

This was an equity long ETF (3x short Tech)


The P/L came in right about + 4.8%, I think I will take a position (Call) in XLK, I don't have much Tech exposure over in calls.

Closing TECS Long Equity For now

Considering an XLK Call

VXX not looking good here

If there were a liquid Ultra XIV, I'd probably take that now, I'm not that hot on options on VIX futures, too volatile.

The charts are consistent through, but to save time, here's a 1 min and 15 min
 1 min

15 min

Quick Market Update

It looks like the short orders in the stack have been hit as far as they need to go.

ALL INDEX FUTURES ARE POSITIVE.

HYG is Positive

The 10+ min Equity averages are still in good shape, intraday DIA is very positive, Q's are positive in the 3-5 min space, 1-2 min is in line, IWM is in line on the 1 min, positive on the 2, 3 and 5.
, SPY 1 min in line w/ the 2 (VERY) and 5 positive.

XLF looks good, XLK is coming along.

The TICK is also starting to break free of the channel intraday and close to +1000 readings.

$USD & JPY as well as USD/JPY are swinging around in to good position.

I'm guessing we're half way or more through today's move if you look at the SPY rounding now as part of the "process", that means we should be coming up on the right side of a "U" reversal.


GS should Bounce- $166-ish

That's what I'm thinking, I don't really like GS as a long for a spec. trade, but I know some of you like to trade it, GS IS a Equity Short position and any move above $160 and I'd add to that short to bring it to a full size position.

By the way, the last time GS saw a quick bounce, it did bounce, but was sold in to hard.

 GS has made the break under support with the rest of the market on a "W" bottom, I wouldn't even mention it if it weren't for the next charts.

The intraday 1 min-but note to the left the last bounce was sold in to hard, that was institutional money selling that bounce.

GS 2 min below support and there are a few more, so a very likely bear trap, I'd just rather be long XLF than GS personally for a spec trade. The GS short stays open, it's about at breakeven right now.

The 60 min chart shows how badly GS has been distributed, it's in a lot of trouble, any move > $160 I'd add to the position or start one if financial exposure isn't a problem.

IWM 98 / XLF 20 PUT P/L


IWM Put closed for a loss of nearly -15%, but only $164.00


XLF Put closed at $.58 for a small gain of 3.5%