Monday, April 15, 2013

Daily Wrap

I'm going to try to keep this short, but there really is so much that could be covered. I saw some analysis suggesting today was the result of bad economic numbers out of China, I couldn't disagree more.

I've been monitoring currencies for at least a couple of months now several times a week as they started with slight changes in character within their respective trends to complete break downs of those trends, this connection moved me so much that I probably spent somewhere around 10 hours this weekend writing about it (Currency Crisis and Currency Crisis Continued).

Other events: Friday's collapse in commodities, it wasn't just gold and silver and the $USD was down making it a favorable environment for gains.

Also on Friday Yields being very bearish for stocks

The VIX futures move on Thursday followed by Treasuries on Friday prompting the post, "TLT and VXX-Real Organic Demand, Fear and Greed?" both were events so out of character that I felt this was the first time we saw real, true organic supply/demand dynamics in play and both were moves toward protection and/or a flight to safety as well as a very clear relative sector performance moving to safe haven assets.

Friday morning in the Pre-Market update I showed the futures charts in multiple timeframes leading me to say,

"Here's NQ first because last night I looked at every timeframe here, 1m, 5m, 15m, 30m, 60m, 4hr and 1-day, all leading negative. I don't recall ever seeing that ll the way through and the longer the timeframe...I say, "When 3C charts jump off the page, don't ignore them" These are the charts I don't ignore."

Even a simple Market Update on Thursday showed some intense distribution.

Last Wednesday in yet ANOTHER example of this concept I'm ALWAYS sure to remind you of before any F_E_D or F_O_M_C event, I put the warning in the title of the post itself...
"Minutes Leaked From the F_E_D...As Always, Beware the F_E_D Knee-Jerk Reaction"

For newer members, the concept of the F_E_D Knee-Jerk reaction is simple, after year of observing the events and reactions I have found whenever there's a F_E_D or F_O_M_C event or policy disclosure, there's almost always a strong knee-jerk reaction and that reaction is almost always wrong as it is reversed usually within a matter of days.

Here are examples from recent F_E_D / F_O_M_C releases to illustrate the concept.
September 13, 2012, the much anticipated QE3 program is announced by the F_O_M_C, the market rallies hard the rest of the 13th and part of the 14th, the knee-jerk reaction.

 Although conventional wisdom was that the market would fly from there as it had before, I wasn't ready to give up on several shorts and go in 100% long because we had multiple long term 3C charts showing  negative divergence in to the F_O_M_C policy announcement, there was accumulation before it that ran the market higher, but as of the 13th, 3C was negative so we didn't change anything despite conventional wisdom and a lot of emails about "Not fighting the F_E_D".

 It turns out the knee jerk reaction were the highs which were not seen again for another 5 months as the market headed -8% lower.

Wednesday's F_E_D minutes knee-jerk reaction and today.

There were a lot of reasons last week that were cause for concern long before the Chinese data missed last night.

I'll be bringing you the futures in a bit after they develop a bit more in to the overnight session.

So far there are 1, 5 and 15 min positive divergences in NQ (NASDAQ futures), 1 min positive divergences in TF (Russell 2000 Futures) which the R2K by the way was the day's worst performer at a loss of -3.78%, nearly double most other averages.

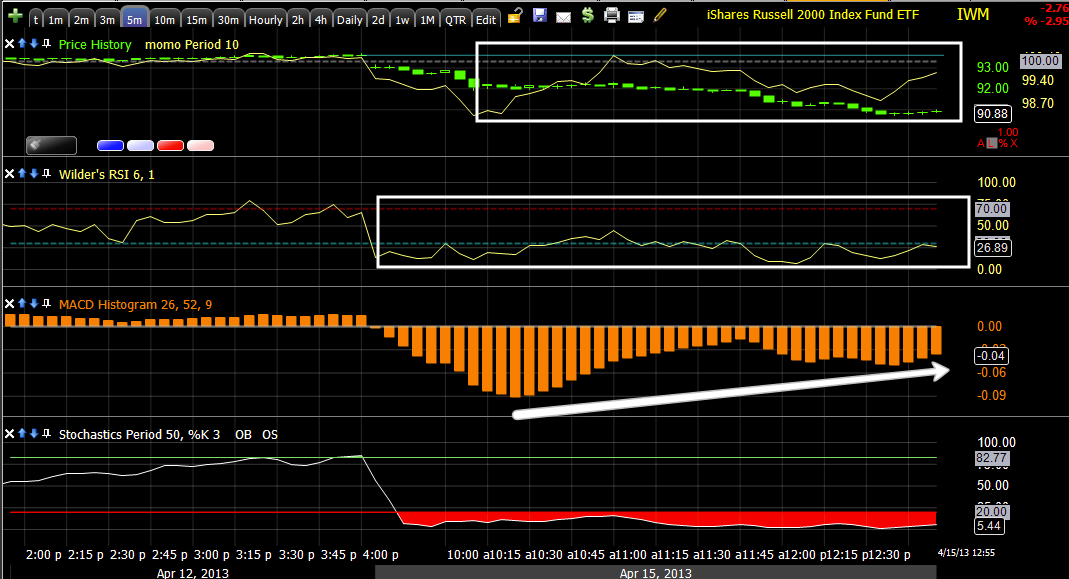
The Russell 2000 would have made for a better "Trend Channel Warning"

The Trend Channel Stopped out the R2K Trend on February 21, 2013 @ $912.15, the R2K closed at $907.18 today, if you were trying to ride the trend and figured the last 2 days before today were just small corrections, you would have made more money stopping out in February than holding through today.

In 1-day the R2K took out 6 weeks of gains and most of the last two and a half months, this is what I've been warning about and now we have a real world example only days, even a night after I last warned about the Trend Channel Stop out (which I warned about dozens of times since it happened).

As for the other futures right now, the ES (SPX futures) are positive in the 1 and 5 min timeframes.

I'll have more on futures and some other stats in a bit as they develop.


Sad Day...

My thoughts and prayers are with the victims, their families and those traumatized by today's events in Boston.

I know we have some members in the area, I sincerely hope all of your family and friends were not caught up in this.

I have a few friends that just moved back and were very athletic, so far I can't get in touch with them.

Trend Channel Warning

Today was EXACTLY the kind of day I have been warning about when talking about gains and volatility after the Trend Channel is broken.

It was just last night in my "A Currency Crisis" Post  that I said these EXACT words...

"Even though SPX prices are higher now, people can rarely separate price action from the clear signs of trouble; I have seen 2 months of upside price gains wiped out in a single day or gap down so these are very dangerous times to be long the market, yet people who read the headlines, "S&P makes all time new high", can rarely see any further than the headline. When the reckoning comes, they stand to lose a greater sum so fast that there's nothing they can do about it, yet the warnings were there the entire time for those who were attentive."

And today alone...
The Red arrow is where the Trend Channel was broken, it is the area that I have said, 

"When  we look back a year from now, this area will be the area recognized as the point in which the back of the trend was broken".

Just looking at last week, today wiped out almost the entire week's gains, there are 21 days of gains that have been wiped out today alone (anything above the red trendline).

I just think this is a good time to remember all of the warning signs and being able to separate short term emotions and headlines in the newspapers and on CNBC about 'All time new highs" and the real facts, the charts flashing red flags, the breadth charts, etc.

The fact is, fear is a stronger emotion than greed. The 2002/2003-2007 bull market saw all of its gains and then some erased in 16 months (after 60 months of moving up) and most of that happened in 8 months. You might be saying, "We'll not if you sold!". That's the problem though, people make money, they believe in the F_E_D and they think that it will come back and they hold and sometimes the market gives them encouragement to believe what they did was right just to lock them in.

There's a sort of parable I like, "A captain in the Army comes across a minefield and decides the best way to cross it is to just close his eyes and walk across, now in that Captain's mind, whenever he comes to a minefield he believes the proper way to deal with it is just to close his eyes and walk across"


Currencies May Add Some Market Support Short Term

As you know, this weekend's analysis that started with observation over a month ago and culminated with strong observations Friday, basically pointed to Currencies being one of the major culprits in market weakness and today that has held true.

Right now there $USD is starting to lose some upside momentum which is market supportive and I believe the Yen will also move lower (it has already lost momentum) which is also market supportive, but these are near term moves along the lines of "Stage 2", this weekend's analysis of the currencies dragging the market lower as a primary trend still stand as valid in my view now as when I posted them this weekend.

I'll bring you the updated charts next.

I don't think there's anything you need to do unless it's position maintenance, taking some profits on shorts or inversely correlated longs, but as far as entering new positions, I think tomorrow we'll be looking at that, today I believe is too early unless you want to take the chance of trying to trade a dead cat bounce, I don't think that's trading, I think that is gambling.

I will bring you the charts, but I wanted you to know what was going on now in the $USD and Yen

GS Short Position

Friday we entered a GS short position (this is considered a core position/potential trending trade)
and here are the charts for GS.

Friday's position is in the green right now.


As you know I'd like to open an XLF Put position (Financials) which overlaps a bit with the GS short, however the Put position is a much shorter term trade and GS is a longer term trade.

I'm going to have to do more intensive analysis of XLF and GS, but I may decide to enter the additional shares I left room for (25%) before any market bounce as I think there's a fairly good chance that GS may show worse relative performance.

I want you to know that in advance in case you see a GS short Add-to or new position alert comes out.

I'll add charts after market to show you what I'm looking at.


SPY Arbitrage and ES CONTEXT Are Closing in on Neutral

CONTEXT went from a 20+ point negative differential to about n 8 point.

SPY Arbitrage went from almost negative $.60 differential around noon to a $.15 negative differential and this is 30 mins delayed.

Oh my lord...

The videos of the Boston Marathon are horrible.

Two Explosions at the Finish Line of the Boston Marathon Just Now

I'm sure all of our prayers and thoughts go out to the victims.

I don't want to be insensitive at all, but this will likely have negative market effects. I feel like a real jerk for saying that, but this is our job.


Market Update :SPY

Again, I REALLY don't want to buy a dead cat bounce, I think this move has to have some base to it capable of supporting a move that isn't just going to fly up and fall down, volatility is already going to increase dramatically so we really need to be patient, maybe forgo some trades and make sure if we commit money, there's a darn good reason for it.

Earlier I mentioned that it would be the early intraday (fastest) charts that would give us a timing signal, if this is the move up, then I'm glad not to have anything to do with it, but if it is part of a "W" base or a rectangle base, then that's a different story, but at least we now know for certain that the intraday charts that I suspected would be the charts that nail the timing, are working as expected.

 SPY 1 min is leading positive and we get a price move from there so it's working as I thought it would even though this is a strange divergence. What I'd like to see is price come back down and that move up act as the middle of the "W" is such a base or the top range of a rectangle.

 SPY 2 min also is leading positive today before the move so that's good as well as the divergence is migrating through longer timeframes and acting as it should. Note the leading negative on the 11th.

 The 3 min chart is also positive, but it takes some time, look at the top divergence and the shape of price, it's not just a sharp "V" reversal, we need to see something like that along this bottom to make the risk worthwhile.

 This is the move from last week. You may remember that my VIX /Market Analysis from the week before predicted a move up last week and that is why we bought calls and a strong move down this week and that is why we bought puts.

You may also remember that I DID NOT trust this move last week as it started on Monday on an algo ramp on the lowest volume of the year, but the REAL PROBLEM was that there was so little accumulation/base. I expected Monday to put in a stronger base before the move up, this is why I didn't trust last week's move to hold.

Finally we are seeing migration to the 5 min chart, look at the leading negative on 4/11, we want to see a leading positive along those lines in terms of size on this timeframe.

Silver might be a Stage 2 Bounce Candidate

There are some signs now of those intraday charts (for timing) starting to put some brakes on this slide lower, but we'll get to that in a moment.

I want to stress 1 thing, if stage 2 (bounce) is going to be a dead cat and that's it (meaning there's not a decent size base to make a decent size move), then I may skip all or most stage 2 longs and just wait to short in to the dead cat bounce (stage 3). The trade still has to be a high probability of success, not just a stronger probability or a dead cat bounce that is volatile and completely unpredictable, that's not a high probability trade.

Here's what I see in SLV and Silver Futures

 SLV 2 min in context with the divergence starting on the 9th and leading negative badly by the 11th.

 The reason why I posted the above chart was so this 2 min divergence can be put in to perspective. Near term 3C needs to turn up and make a higher high to really lock this in.

 The 3 min chart is the same, there was a leading positive earlier, but now 3C needs to make a new high to lock it in and make it count.

 The 5 min chart is leading positive, however like I said, if that leads to a dead cat bounce tomorrow, that's not a move I want to invest in, it would be too unpredictable, however because of the longer divergences in the futures, I have a feeling that won't be the case with most assets, silver may be an exception just because of the nature of the move up until today.

 SLV 10 min shows the positive divergence that caused us to buy the leveraged AGQ 2x Bull Silver ETF, but note that there's at least 3 days of positive divergence in to some lower prices so it was a decent size base. We sold at the first negative divergence on the 9th so we bought at the very bottom, sold at the very top for a 8+% 3.5 day move. I also wanted to put the current 10 min divergence in to perspective.


 Here's the 10 min up closer so it needed to be put in to perspective.

 The SI/Silver Futures 30 min 3C chart with the positive divergence in to the 4th and negative in to the 9th. One thing I like is the heavy volume recently in silver, it looks like short term capitulation.


 The 15 min SI futures have a decent positive in place, this could be worth investigating and possibly looking at a partial position. I'd rather see SLV have more of a base first.

SI 5 min chart leading positive today in to a flat range seen in SLV and heavy volume, perhaps we get a SLV closing candle like a star or Doji, then a gap down tomorrow with positive divergences and a move just above today's close would be a higher probability of a bullish engulfing candle on a star reversal candle today, that may be the set up worth looking for.

Quick Market Note

There are some signs now of those intraday charts (for timing) starting to put some brakes on this slide lower, but we'll get to that in a moment. SPY intraday charts are a good example. I'm going to update Silver and then we'll look at the market averages.

Levers Are Definitely Being Pulled

In the last post, "Leading Indicators Update", because of TLT price action I suspected that the levers of short term manipulation were being pulled to help the market, I can confirm that now.

It's not showing up in the Capital Context SPY Arbitrage yet (at least not green, but the red histogram is shallower-it is also about 30 mins delayed) because that is based on price of TLT, HYG and VXX, 3C can give us a look in side the underlying action before price ever moves so I'm willing to bet it will show up in SPY arbitrage, it's just showing up in 3C first.

 TLT 1 min with a leading negative divergence

 TLT 2 min the same

 TLT 3 min the same

 TLT 5 min shows both the price and 3C divergence

 Here's the SPY (green) vs TLT (red_ divergence I first saw, TLT should be higher.

 VXX 2 min in to price strength, If I had taken the VXX/UVXY long trade from last week, I'd be looking to close it out soon, maybe with an intraday trailing stop.

 VXX 3 min leading negative

 HYG (Credit) 1 min leading positive

 2 min the same

 3 min the same

5 min negative before the price plunge and positive now on a relative basis.

At this point I'd be looking to wrap up stage 1 from this morning on short term trades:

Stage 1
This means, take some profits on shorts/Puts in early selling

I'd be patient, but start looking for any high probability stage 2 positions.
at some point we can ride the bounce long 

Eventually we'll get to stage 3 I believe.
 and then ...

ES 60 min VERY negative, we want to sell in to price strength or short.

Quick Leading Indicators Update

As far as Credit goes, HYG and JNK are following the SPX nearly tick for tick, more or less, good confirmation of the trend. High Yield Credit is similar except it hasn't made a lower low since about 9:50 a.m.

Risk sentiment wise, FCT is showing a little improved risk sentiment, HIO has improved from 11 a.m. to present by making higher lows vs the SPX.

Around 11:40 VIX futures were showing a lot more fear than the SPX's movement would indicate, they've come in to line since then. TLT is showing a bit of a negative divergence between April 5th and now, the normal correlation would suggest TLT be higher than April 5th, it is not so I need to look at the 3C charts there, they may be using some levers already.

$AUD which I mentioned last week as tracking the market better than the Euro showed much more negative sentiment early today, it has improved recently, which is more market positive or maybe I should say "Less market negative". The Euro is showing some relative support. As mentioned on the 3C charts of the Yen, it looked to be showing more local support, price action is as well as the Yen hasn't made much of a higher high vs the SPX's lower lows.

Yields intraday are becoming more supportive which would also suggest the TLT levers of manipulation are being pulled, on a longer timeframe, the SPX has caught up to (reversion to the mean) the leading downside I pointed out in Yields last week, now they are pretty close to in line. On a longer term or big picture basis, Yields are VERY negatively dislocated from the market.

Commodities have shown improvement since 11 a.m. and are market supportive, but again we are talking about stage 2 , short term bounce-which could be quite strong, but still the big picture of the market is much weaker than any short term strength.

In relative sector strength there aren't too many surprises except Tech is showing better relative strength than other groups and even more so, Financials (which I've been looking for a bounce to short in to)  are showing much better relative performance than other groups.


Back to the Currency Connection

The Currencies are a big part of what I believe to be driving this market, especially the Yen and the $USD so lets look at the action in the Yen as to what it tells us about the market in the near term, you already saw my post from this weekend about the bigger picture which is not only closer and closer, but I believe we are already in it, it's just the market is never going to make it easy and is not going to give you a clean, clear straight down reversal without plenty of head fakes along the way, so we need to look at all the clues.

 The 30 min Yen is one of several longer term charts that show very high probabilities of the Yen strengthening further to the upside which is market negative, but even here on this leading positive 30 min chart, we have a small negative divergence suggesting a downside pullback which is market positive (along the lines of that stage 2 market dead cat bounce-or whatever strength bounce it is -not a primary trend reversal in my view).

 The 15 min chart has more detail and shows a sharper negative divergence in the Yen and a Yen pullback is market supportive so this actually is confirming the Futures and market averages' charts.

 This is one of the stranger divergences I have seen in the market and the futures as the mid terms have seen strength and it seems to be up to the short terms to bring that strength to the point of reversal. Here the 5 min chart has a hint of a negative divergence so it needs to (like the market averages) show a more positive divergence and then we know we are closer to the actual price reversal although we can already see it in price momentum as the upside momentum has faded.

The 1 min chart looks choppy, like lateral trade, so that would be similar to a "U" or "W" reversal base in the market averages being the Yen is essentially the mirror opposite of the market.

Wherever we can find the most clues and put them together is where we have to look. That's why there's the saying, "To make money, you have to see what the crowd missed".


Stage 2 Timing-IWM Example

This may be tricky, normally I'd expect more of a "U" or "W" process, but in a dead cat bounce this is one of the few times we can get "V" reversals, I'd much rather see some lateral movement or "U" shaped as this gives us more time to get ready, but for an equity example of stage 2, this should give you some idea as to timing and each of the averages are going to be a bit different (but if they start moving in the same fashion that will be a good signal) and there are other things like leading indicators, levers, etc.

 IWM 3 min (remember I said the divergences in the averages which are 10 hour or so behind the futures, are typically in the 2, 3, 5 and some 10 min charts). When the 3 min starts leading that will be a better signal leading us closer to timing I believe.

 IWM 5 min with a relative positive, 3C needs to turn up and lock that divergence in.

 IWM 10 min has turned up and locked in the relative positive. From that point the faster timeframes should start giving us the finer point information.

 The 1 min chart for instance is in a positive positive, if it can lead a bit further as I show with the white arrow, then we are getting started on the reversal process (U, W or V shaped).

 Next, after the 1 min locks in its divergence it needs to migrate to the next longest timeframe, the 2 min which is almost perfectly in line so a positive divergence here will be very telling. From there they should continue to migrate through longer timeframes and build on what is already there.

Since capturing the charts, the 1 min above has made that move higher that I drew in.

Also momentum charts should improve. There actually is the start of improvement on those.
 1 min momentum IWM -MACD is improving, maybe Stochastics, RSI is improving and momentum in the top window is improving. We should see that migrate as well to say the 5 min chart below.

Momentum is improving, RSI hasn't gotten any worse so it's relative positive, MACD is improving and Stochastics is the same.


Quick Market Update

As for the averages which are 10-12 hours behind the futures (even though the futures see much lower volume overnight) they are seeing positive divergences in similar timeframes as the futures, not so much in the intraday 1 min that calls intraday moves pretty well, but building in 3, 5 and 10 min timeframes and some 15 min in very small divergences (only some averages), but that is along the lines of the positives building shown earlier this morning before the open  in the futures, basically the 5 and 15 min timeframes so the initial thoughts about early down side today with building positives in to that downside for a "dead cat" kind of move, with the longer charts still horribly negative (leading to a bad downside move) is still on.

Or, exactly as I put it in the pre-market update.

This means, take some profits on shorts/Puts in early selling, at some point we can ride the bounce long and then ...

ES 60 min VERY negative, we want to sell in to price strength or short.

Sell in to price strength for what should be the big move.


Example in ES and NQ as they are building a little different, but the same concept, with the concept over each timeframe...

This means, take some profits on shorts/Puts in early selling,
 ES 1 min


 at some point we can ride the bounce long and then ...


 ES 5 min


Sell in to price strength for what should be the big move.


 ES 60 min

This means, take some profits on shorts/Puts in early selling,
 NQ 1 min


 at some point we can ride the bounce long and then ...


 NQ 15 min


Sell in to price strength for what should be the big move.


NQ 60 min


I hope that makes sense, it should be the intraday averages' 3C charts that give us timing for stage 2 and 3, we have already seen stage 1

Stage 1:
"This means, take some profits on shorts/Puts in early selling"

Stage 2:
"at some point we can ride the bounce long and then ..."


Stage 3:
"Sell in to price strength for what should be the big move."

AAPL Update

You may recall that AAPL was interesting because of the 10 min, REALLY the 15 min and the 30 min charts, they were looking quite good, however even though I thought AAPL would make a move to the upside last week and it did probably less than a few hours after I posted that, I didn't feel comfortable with AAPL because the short term charts in the 1-5 min range were not confirming or in line with the longer charts. You may recall I said, "I'd rather miss the move than take a trade I don't feel is high probability". My real interest in AAPL was a possible longer term, bigger trade.

Well now things are sort of flipping, the short term charts are looking better this morning as you might have guessed (from IWM and market updates), but the longer term charts that were positive saw so much damage from last week that they are no longer what I'd call positive and AAPL is basically just about back to where it was when all of this started so I'm glad I didn't open a longer term position there.

Here's an update and a sort of "reset" for AAPL and we'll see where it goes from here. I am a bit tempted to take a short term long position that could even turn out to be a day trade, but again I think I'll hold off until the probabilities loo better, even if I miss some upside (my interest in AAPL was in the longer charts and a bigger move, not volatile chop that is up 2.2% from last week's move and down over 2.5% since.


 As for the daily chart and the "bigger Trade" in AAPL that was what was really interesting, I'm glad to have waited on that as the result was just chop, good for a short term trade, but that's not what I was looking for.


 This 15 min chart as of April 9th was what was so interesting. However last week as damage was being done, I suspected the negative divergences would continue to migrate through the higher timeframes and ruin this 15 min chart.

 This was the 10 min (and is the present position of the 10 min), it was because this chart was negative and had not turned up (ending the damage) that I suspected the 15 min chart would be corrupted.

 Here's the 15 min chart now, a big change since the 9th and 3C still hasn't turned up so there certainly could be more damage and just like that, because there was no confirmation in the shorter charts, we were right to stay away from a longer term trade in AAPL.

 Here's the 1 min intraday as of today, there's a decent relative positive divergence and a leading positive today, this looks interesting in the very short term, but not enough for even a short term trade.

 The 2 min chart after having gone negative at last week's highs is now looking better with a leading positive divergence, still not enough for a short term trade,

 This is where it gets interesting, the 3 min chart, after having gone negative at the week's highs, is positive this morning. However this was one of the really troublesome timeframes in the longer term trade analysis. Take a look at the same chart zoomed out to where it was troublesome last week.

 In the orange area, there should have been a positive divergence in to that pullback, the fact there wasn't is what really discouraged me from any longer term trades based on a positive 15 min leading divergence. In context, all of the sudden today's divergence doesn't look very special.

And the 5 min chart so far is in line, the positive divergences on the 1-3 min charts are not yet strong enough to migrate to the 5 min timeframe which is where we really see the first (earliest) timeframe that represents institutional underlying trade.

So that's where AAPL is now, the 15 min chart is no longer interesting as to a longer term trade and we have the small start of something positive, but nothing much more than that. We now know where AAPL sits and have to see where things go from here.