Monday, July 9, 2012

Risk Asset Layout Update

 CONTEXT didn't look too excited either in to the AA AH run up.


 Commodities showing much better relative momentum than the SPX today,,,

 Longer term the confirmation troUble with commodities seems to finally be ending, this doesn't mean commods can't fall from here, but as long as they stay roughly in line with the SPX, the sub-intermediate uptrend can continue (AFTER A PULLBACK-AS THAT LOOKS TO BE THE NEXT SIGNIFICANT MOVE COMING).

 Commodities vs. the Euro intraday, you can see what commodities were following, albeit at a rate that is above the normal correlation. Tomorrow we may get some commodity short set ups as they look to be in the over-valued area now. I was hesitant today with GLD and USO, they didn't look quite ready, but tomorrow I think we have a good chance of picking up a few trades in the space.

 High Yield Credit is holding up-this too is supportive of a resumption of the sub-intermediate uptrend, so long as HY credit can maintain a rough correlation with the SPX in the days ahead.

 Longer term the first time HY credit fell out with the SPX, the SPX pulled back shortly thereafter. So far so good.

 High Yield Corp. Credit, a bit choppy today, but all in all, in good position longer term.

 The longer term view.

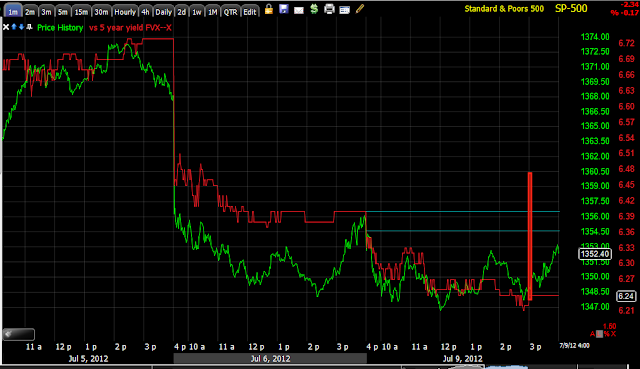
 Yields were roughly in line today, they close an hour earlier than stocks so we didn't get to see if they'd push up with the market during the last hour.

 Longer term this is one of the worrisome charts as the dislocation is pretty dramatic here and Yields are a good leading indicator, this gives you some idea of what a pullback "could" look like and why I have suspected this pullback will be more volatile than what we'd normally associate with a pullback, but that is totally in character with the market's behavior which has been a meat grinder for those chasing the market or trying to force trades on the market. The market sets the rules, we just try to use the proper tools for its mod.

 The $AUD still in line with the SPX, still supportive.

 Looking at the Euro/Dollar update from today, I'm thinking that this move in the Euro is being sold in to. If the Euro can lift a bit more, the SPX can probably get into Friday's gap area, so long as the current 3C readings continue on course, everything makes pretty good sense with selling expected in to any quick move higher in both the Euro and the market lading to our pullback.

 Longer term, another worrying signal as the Euro is very diconnected from the normal legacy arbitrage correlation, I'm surprised arbitrage traders have let this go on so long without taking advantage of it.

A for sector rotation, it looks pretty much like I would expect, given expectations. Financials, Energy, Basic Materials, Industrials and Tech are slowly leaking off as the market looks to be getting ready for that pullback while the flight to safety trades rotate in, Healthcare, Utilities, and Staples. Discretionary is the only risk on sector that seems to be holding its ground, although not in strong rotation.

3C is not as enthusiastic as ES in AH.

Could it be the AA theory is correct and we are seeing selling in to some price strength here?

AA earnings

Update from ZH

 " AA beats (headlines - at first glance though Adjusted EBITDA is half Q2 2011's) and is holding modest gains after-hours - though well of initial knee-jerk reaction highs"


I wonder if this might be a "sell the news event later as the devil is always in the details and may explain why the 1 and 3 min charts were positive today while 5 min, etc was negative.


In other words, the short term accumulation by market makers/specialists on the 1 and 3 minute timeframe would see those accumulated shares being sold in to after hours and as the devil in the details is discounted by the market, the 5 and 15 min negatives take over. This "could" also be enough to move the market in to the gap early tomorrow and if the AA story plays out something like I described, would provide some of the catalyst to finish up the short term divergences in the market that have suggested a move in to the gap before pulling back in a more serious fashion.ck 


A quick reminder of A charts of interest...


 AA 1 min positive I mentioned earlier and 3 min positive below...

 3 min

 The 5 and 15 min above and below.


"If" this scenario did play out, then it would be fairly likely that there was a last minute leak that more or less said AA's headline number will beat, there will be a knee-jerk pop, it will be sold in to by smart money as the devil/details come out.


That would be interesting, it still wouldn't be an earnings trade I would call out as it doesn't have the profit potential considering the earnings risk, but interesting.

Euro/$USD Update

You can pretty much use the Euro or $USD updates very much like a market update, you just have to understand that the market normally moves in a risk on mode with the Euro, a weak Euro generally means a weak market.

The $USD has an inverse relationship with the market and most commodities so a strong dollar or a positive divergence in the dollar suggests the market will head down, a weak dollar suggests the market and commodities will head up. Oil right now is a bit disconnected because of event risk and the market overall is a bit out of sync with the normal correlation, it's one of the things that's been bothering me as far as the market moving much higher from here.

The charts below have good correlation among each other and with their natural correlation with the market divergences that are in place and for the most part, confirm the different timeframe trend expectations I laid out in last night's "The Week Ahead" post


 Euro short term or intraday charts are seeing deterioration, this is generally considered a near term market negative.


 2 min


 3 min

  The 5 min chart is still holding a little positive divergence from Friday-the short term charts negative stance hasn't migrated this far yet.

 The 15 min chart is in line with price action. Being the SPY 15 min is negative, it is easily understandable as the market has not seen the same downside the Euro has, nor the downside we'd expect to see from the FX/Equity correlation, I think they will meet up as stocks pullback and revert to the normal FX/Equity correlation.

 Interestingly though, like the market's longer term charts in which I explained the various trends last night, we have an hour and 4 hour positive divergence, again suggesting after we see a pullback, we still have more upside to go before a primary down trend re-asserts itself.

 4 hour

$USD (via UUP)
 As we see deterioration in the Euro short term charts, we'd expect to see some positive movement in the $USD short term charts (as the signals should be the opposite for confirmation) and we see that here on the 1 min as the afternoon wore on.

We have some negative movement in the 3 min $USD, which is not too far off the positive Euro 5 min still in place

 The $USD 5 min is still negative, much like the Euro 5 min is still positive. Short term this still suggests the market is not quite done and perhaps we are still heading for the gap from Friday.

 The 15 min $USD is positive in line just as the 15 min Euro is negative in line. This again supports the negative 15 min divergences in the market, all 3 confirm each other (market divergences and Euro/Dollar divergences); they all still point to a decent pullback move, this is why I wasn't too worried about watching AAPL closely for the best entry, I think it's close enough for the time I have to devote to watching it.

Interestingly, the Euro 60 min and 4 hour positive is met with a similar 1/4 hour negative in the $USD, which also matches the market divergences, so all in all, we have pretty good confirmation of the different trends I laid out in last night's post.

AA Update

Alcoa kicks off earnings season after the bell today. As for the charts with regard to AA earnings, I don't see much there suggesting a leak. There are some interesting features in the AA charts in a couple different timeframes you my be interested in, but as far as a bonafide leak, I don't see it.

AA's 1 and 3 mi intraday charts do have positive divergences, they look like they may want to rally in to the close.

Longer term is interesting...


 The 4 hour and 1 hour above and below are both leading positive and suggest that AA has been building a little base in this area from which to lift off of.


 The 15 min chart is not showing the kind of positive divergence I would expect to se if there were a positive leak, being it is in negative position, it looks much like the rest of the market and it would be difficult to say there's a negative leak.

The 5 min chart which I would expect to see real movement before earnings if there was a leak, has been flat today, although it is in a leading negative divergence, this is not too far off the general overall market tone though and I don't view it as suspicious.

Quick Market Update

SPY 5 min chart with the gap from last Friday.

When we have intraday positive divergences  like we have now (typically the 1-3 and sometimes 5 min charts), we generally see corrections, that would be the best word for it. A correction can be through price or through time, price meaning a correction in price to the upside, most likely contained to the gap, or through time meaning a lateral consolidation. The short term intraday positive divergences that appeared later Friday have kept the market from falling and have thus far consolidated through time in a lateral motion.

There are still strong enough 1,2 3 (and even a 5 min here or there) min. divergences to move us in to the gap. The SPY/DIA look the best in this regard. The QQQ/IWM look the worst, perhaps that's why I favored the AAPL Puts today.

There's some deterioration in the strongest (SPY/DIA), but not enough that I would say this short term divergence episode is over. I don't mind the AAPL Put position because the episode looks more like noise than anything serious and the most visible divergence is still on the 15 min chart and even 30-60 min charts for a decent size pullback or "correction".

I'd like to take a look at the Euro, Dollar and the Risk Asset Layout before the close and of course AA to see if there are any interesting changes.


Opening AAPL Aug. 615 Put

This is about a normal size position, you may get a little better intraday price, but this is fine for me here.

May look for a Put position in AAPL

This is all I need to know about AAPL for the next several days at least (remember the market is highly correlated).

 3 min negative

 5 min leading negative

 15 min leading negative

 30 min leading negative

There's a small relative neg. on the 60 min, but pretty close to in line, I'd consider this a pullback trade, deeper than you'd normally think of when thinking "pullback"

I think AAPL is still in decent position here for a new trade.

FB Update

As of the last FB update earlier today, my expectation was for a rounding top/pullback and then to just be patient and see what develops.

 FB's 60 min chart has improved since the pullback/consolidation in the yellow box.

 Here's the rounding top that was developing earlier today, volume is nearly perfect for this price pattern.

 The 1 min chart is showing some relative strength in the very short term, we may see an intraday bounce or perhaps this chart continues to strengthen and migrates to the longer term charts which is one of the possible trade signals I was looking for. Note the gap area in yellow, this would be an interesting area to see how 3C reacts.


 However as long as the 2 min chart looks like this, I find it very difficult to justify a long position on a new entry here,

 The 3 min chart also leading negative

 The 5 min as well....


And a relative negative in the 15 min. I'd like to see these charts shape up before entering a new long position in FB which I have been waiting for for at least a couple of weeks. However, I'd much rather let the trade come to me than chase it, especially on a move like today, it seems a few people may have been caught chasing it judging from the downside volume on the second half of the rounding intraday top.

GLD Request


 GLD 2 min relative negative

 GLD 3 min leading negative

 GLD 5 min strong relative negative

 GLD 15 min relative negative.

The 30 min chart still suggests that trades in GLD should be from the short side.

I don't personally see any VERY strong signals here in which I would want to take a new position unless it was a very small, speculative position.

I still have some open GLD July $155 puts which I'll leave open with the charts the way they are, but I would not personally want to open a new position at this time.