Wednesday, May 11, 2011

Market Update

At 2:18 I posted a market update showing a positive divergence building which seemed to be a simple oversold intraday correction.

Here are the results and what 3C looks like into the close.

 The DIA from the time of the update until the close, this wasn't a huge positive divergence so the upside after the update is about in line with what I'd expect.

 Into the close there's a bit of a negative divergence there, it's also not a huge divergence, it's not a leading divergence , but it did fall out of confirmation of the intraday relief move.

 The IWM

 The IWM posted the weakest divergence, in fact I don't even think you can call it a divergence as price levels were relatively the same, so there's the possibility of some more upside here tomorrow morning.

 The QQQ probably saw the most upside of all 4 averages.

 The divergence here is a negative divergence, again not very deep, certainly not a leading negative. Note there was an earlier divergence at the previous reaction high so once again, there is the possibility of a continuation of this move into tomorrow morning.

 The SPY didn't move much, but it was the biggest relief move for the ETF on the day.

This divergence is probably the most serious of the 4.

The bottom line is that there may be some more intraday upside tomorrow in the early going, so long as it doesn't start to lead price upward, it would probably be a good opportunity to pick up any short positions you may be looking at. I'll of course update any morning action that would help you wit tactical entries or warn of a shift.

What I did find interesting was PSLV's chart today.
There's a pretty strong divergence there, a leading positive divergence actually. When we see these divergences and they don't react (meaning there's no upside move) it suggests continuing accumulation especially in such a flat trading range. It will be interesting to watch PSLV/silver tomorrow to see if there's a decent move up on this positive divergence.

And It Starts

From the last market update...

 IWM 5 min

 QQQ 5 min


SPY 5 min

And as you might expect, some of this is flowing out of "safe haven" treasuries and into equities.

PSLV even looks set to put in further gains intraday.

Oil doesn't seem to be showing the same shot term conviction.

PSLV update

Along with much of the rest of the market, PSLV should see a decent intraday upside bounce.

PSLV 1 min.

Market Update

 Downside momentum has dropped off and the Q's are a bit lateral as well as the SPY and DIA
There's a 1 min positive divergence starting. Nothing goes straight down and the losses thus far this far make it reasonable to expect a relief bounce shortly.

TZA

TZA is another May 3rd trade idea...

TZA, looks almost exactly the same as EDZ as far as the accumulation period and the quick change in character yesterday.

 The 60 min chart shows the same accumulation strategy as EDZ

And yesterday's 10 min chart shows the same quick change in character with accumulation coming at the lows of the day as the market broke out in the late day "false breakout".

This is another worth considering. The daily chart pattern is a bit different with this one and will occur on a break out above a descending trendline between $36.50-$36.75.

Please keep in mind that these ETFs can be a good way to get quick exposure to a broad based sector without the need for individual stock picking, but they should not solely represent your portfolio. As I've stated before,  prefer to have a mix of ETF's and real equity positions, especially short equity positions as there are some advantages the equity shorts have that ETFs do not. There's also the issue of one day performance in ETF's and the danger compounding can represent in a choppy market.

EDZ

EDZ is another trade idea from May 3rd at $17.26, it's now up nearly 8%.

 EDZ daily-rectangle base

 Here's the hourly chart that has looked very bullish and has shown that there was a concerted effort to accumulate EDZ at the lowest levels possible. The first accumulation round took EDZ up to the upper limits of the trendline, but they weren't ready to break it out yet. We saw a negative divergence sending it back down to the lower trendline where it was accumulated again.

Here's the interesting chart, it's a 5 min chart and shows the same swift change in character we observed throughout much of the market yesterday.

While EDZ is an open trade from May 3rd, it can probably be bought here as well, or if you are more interested in higher probabilities, then a breakout above the $19 area would be an ideal spot. Again, there's no huge rush here as this hasn't even moved into stage 2 mark up yet (that would happen above $19). Also according to the price pattern implied target, this is another ETF that looks to be headed toward the $55-$65 level eventually. The key to arriving there will first be the breakout and then putting EDZ in the appropriate Trend Channel and letting the Trend Chanel do the work rather then relying on arbitrary guesses as to when to stop out.

FAZ

The idea that this has been a speculative money unwind has been floated here a lot lately. If we follow the pattern of the 2008 unwind, first went energy, then equities, then of course we had the banking crisis. FAZ has been mentioned as a long candidate recently and I think it probably makes just as much sense now as ever.

However, "if" I'm correct that money is going out of commodities, out of equities (and the market darlings that have been leveraged up will be the hardest hit) and into treasuries, then the trade becomes almost anything short or in this case, long an inverse ETF like FAZ which is the leveraged inverse on financials.

 FAZ's price pattern implied target would be around $65, the shorter target would be somewhere in the $49-$50 area.

This is an hourly 3C chart and a pretty strong looking one at that. The trade could be put on here or with confirmation of a breakout of the triangle base around $42.50 or so.

Thus far we've witnessed a very fast change in the markets. I have to slow myself down a bit, while also not missing out on the opportunity. Thus far everything suspected yesterday seems to be coming true today, from the false breakout late yesterday to the idea that not only are commodities being de leveraged, but also equities and the target for the money flow would be into treasuries. When things happen this quick and it seems like you're on the right path, it's easy to get over-zealous and jump in with both feet. We have t remember that the market's specialty is curve balls so while I personally would be making moves right now to get positioned, I'd also take a step back, take a deep breath and remember that if this is a macro trend that is starting to develop, there will be plenty of time and opportunities so don't go betting the ranch, don't forget about risk management and keep your eyes open to al possibilities.

PCLN Update

The trade proposed on May 3rd for PCLN is in the green for about 4% at this point, but remember what the trigger to the trade really was, the break below the breakout area, causing a decent sized bull trap. We're getting close to that area...

 Here's the breakout point at the lower red trendline.

The Trend Channel which has held the entire move since Q3 2010 will break at $510 and a major psychological break will occur at $500.

 This is the same channel as above if you want to use a long term trending stop, it's around $542 which would still put the trade at a little better then break even.

 A slightly tighter stop, but one that will move down faster can be found here. For all intents and purposes, it also is around $542, but as I mentioned, it will move down much faster locking in profits.

If you just want to play the swing, here's the 60 min TC with a current stop at $527

And This Isn't Coordinated?

Trade in the Energy Futures Market was HALTED! It also looks like the CME doubled daily limits on gas, heating oil and crude.

I'm not sure which way to interpret this, however given the hike in oil, I don't think it's there to protect against a panic sell-off, although that might be an initial thought. How about this, there's a bit of a sell-off, people start getting a bit panicky and the CME closes access to the markets. What effect would that have on an already "panicky seller"?

Treasuries may be the winner!

I put together a watchlist of different treasury funds and ETFs, most have extremely low volume, so I picked  one that had some decent volume which happened to be an ultrashort and it's counterpart, the ultra.

Remember, we are looking at a VERY recent change in character (also recall Bill Gross's very recent change in stance as if he was hedging against the opinions he's been rather vocal about lately).

 This is TBT an Ultrashort 20+ Treasury ETF, it had the biggest volume.

 Here's the recent long term outlook which suggested TBT was in for a move higher (same as we saw in silver and commodities, but to a lesser extent in those two-then we saw a change of character in that cycle yesterday)

 Here's TBT on a 5 min chart going from bullish to a negative divergence.

 The 1 min chart shows this much more clearly.

 And here's this morning's price action in TBT on a 5 min chart, that's a pretty steep dive. This would be a candidate, although not too exciting, but it's not the only candidate.

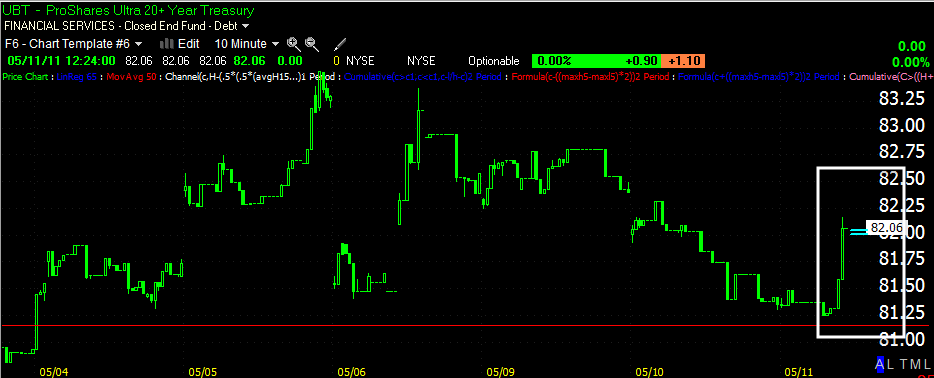
 Here's the counterpart, the Ultra or bull 20+ year treasury. First note there's that same long term bullish pattern seen in TLT, with a breakout and a benign pullback.

 The long term 3C suggested it was prepping for a decent cycle lower.

 The 5 min however has had a recent change in character toward the bullish side with a positive divergence. It should be noted that although this is the same fund, only the inverse, the volume here is much, much lower.

 Here's the 1 min chart.

And this morning's price action.

Of the two, I'd chose the higher volume TBT Ultrashort, but as I mentioned, these are not your only choices.

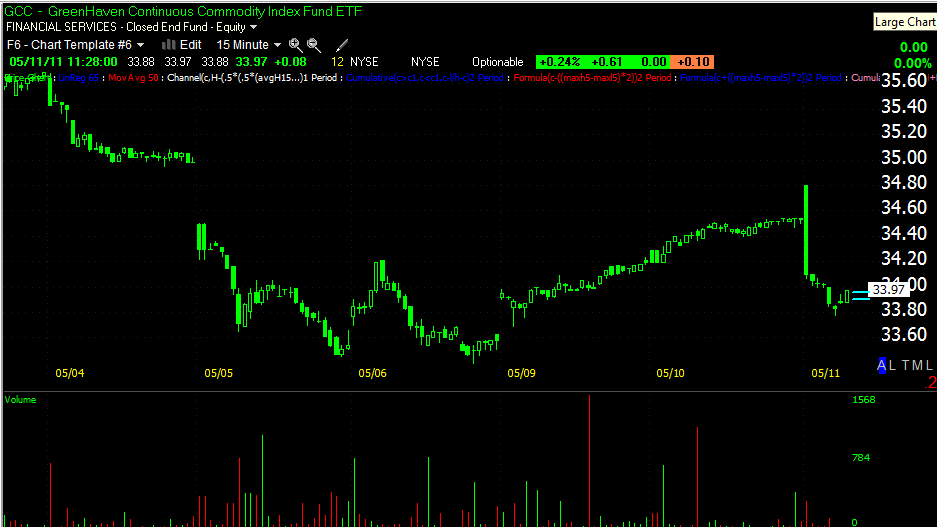
If money is indeed flowing out of commodities and stocks and toward treasuries, then you have significant short sale opportunities in commodities and equities.

Remember late yesterday the breakout in the SPY and I said, "we need to watch this for negative divergences and a breakdown " as it's likely a false breakout?

Well, I'm pretty sure we can call that white box from yesterday a false breakout. Remember the reasons I gave as to "why" they create false breakouts, "the snowball effect", I think that's pretty clear to see as well today.

Another Example

Take a look at FCX this morning....

For those who my not know what a bear flag looks like, I drew it in for you with the red trendlines within the red box. This is how a bear flag "used" to act before Wall Street's black box trading systems started taking advantage of technical traders and causing false upside breakouts before the flag truly broke down. Again in the case of FCX, it looks a lot like they didn't have time to run the game which probably means they are more worried about repositioning their portfolios quickly then making a few extra bucks. This all suggests that these commodity margin hikes are working as intended. It also seems like Wall Street doesn't really know what's going on as they are just trying to get out of the way. Further evidence which would back up that view is the number of funds coming out of the woodwork talking about the significant losses they have taken, losses they would not have taken if they had a heads up on what was coming down the road. From Bernanke's perspective, I doubt he's shedding too many tears after 4 nearly consecutive hikes in silver. If they didn't get the message, they only have themselves to blame. It seems with the oil margin hike, Wall Street has finally confirmed they "got the message".

Now, where's the money going? Pimco is sitting on significant levels of cash as of the last report, which would suggest their not sure which way to go with this. Last week we also saw the Yen Carry Trade totally obliterated. As I mentioned yesterday, equities would seem like a rather benign place for money to flow toward as far as the chairman's concerns over inflation, but an even better place that would be more helpful (especially when considering yesterday's auction of treasuries and the very low indirect bidder interest) would be into treasuries. Bill Gross came out with some unexpected comments about how and when he might reverse his position on Treasuries.

TLT's pullback has been pretty benign


Is Bernanke Wiggling Free?

The recent hikes in Silver and Crude seem to hae the entire commodity complex on edge, who knows what's next. Remember that these funds are like super tankers and can't just drop a position in one order like most of us. With the margin hikes has come that nasty word on Wall Street, the one that keep fund managers awake at night, "uncertainty" and when you have a super tanker that may need to make a dramatic course correction rather then plunge into a possible reef in uncharted waters, as the captain, you'd probably start making a course correction now.

We have some evidence that this may in fact be the case.

 First we have a bear flag in the red box in the CRB commodity index. The notable feature seen here (unless the flag is not finished forming) is the fact that there was no false breakout above the flag. The bear flag in one of the most watched sectors this week would be very obvious and very obvious patterns are almost always broken up, but not this time. It seems they just high-tailed it out of commodities, who has time for false moves when the next margin hike could come down any minute?

This is a definitive change in character with regard to Wall Street behaviour that we have observed over the last several years and suggests that Wall Street doesn't have the luxury and time right now of setting up quick money making traps, they seems more interested in packing up and getting out before the 10 a.m. check out.

 GCC is another commodity index, this one did take the opportunity to run a quick game on the bear flag, but it was a quick one and perhaps one they needed to run.

I can see the cycle here without even using 3C, it's very short, not at all commensurate with the accumulation period. However, what really stands out on this chart should be obvious to you, it's this morning's action and being this i only a 15 minute chart, they did take the opportunity to play the game, but real quick. The large opening candle took 15 minutes to construct or destruct. You can see that this price action is very out of the norm for GCC.

PCLN

 Important PCLN levels. We already saw the break below the lower trendline which would also be the area in which the move above it in PCLN would be considered a failed breakout. It has already created a decent size bull trap with over 2 weeks of longs taken out on stops when price briefly closed below the support level. At the time I mentioned that we'd likely see a bounce off that level which we have, it was held up at gap resistance which is some of the strongest resistance you'll find. PCLN is a special case because of its "market darling" status. A failure of this breakout area will likely lead to margin calls and a quick drop.

Just this morning on the open we saw a move above the gap resistance level that failed quickly and sent PCLN lower. This was not a random move and PCLN gave up 6 points in an hour.

However, the lower support line is where the real action will be found once it is decisively broken.

USO and Lessons Learned in Silver

USO is another that seems to have ended a cycle very quickly and prematurely, but the initial margin hike was seemingly taken much more serious this time then it was in silver. Whoever is behind these hikes seems to want to effect an outcome, that of lower prices in commodities, I don't think they want to take down 100's of funds n the process ad therefore allowed the funds some time to exit their positions before the next hike, but it seems the funds were not getting the message when it comes to the silver hikes. It looks like with the oil margin hike, they got the message and took the day allotted to them to exit positions and used it for that.

 USO 15 min-again another rather short cycle that ended abruptly.


 10 min chart, remember yesterday the change in character, here it is visible on a 10 min chart clearly.

 USO 5 min chart another abrupt change in character, but one that allowed funds to get out of the position probably a bit better then break even.

And the very abrupt 1 min chart.

From what I see, silver was the first hike, Wall Street didn't take it seriously so a series of hikes nearly every other day came down the line until they were forced to take it seriously. It seems with crude, lesson learned.