Monday, February 14, 2011

VVR on the speculative list just triggered

on the list 2/7 -triggered long

And This Could be the Reason Why

MERS shot down


Here's XLF right around the decision...


I doubt they'll be able to hold financials up too much longer, this is big for the banks.

Furthermore..

Look when the volume kicked in, right as the TICK index was trending down and going negative, meaning more stocks were trading on a down tick then an up tick.

Another Example of Manipulation

Smart Money simply does not buy this way unless something huge and unexpected happens, like a Fed event.

Again, no sign of a positive divergence, just wide open volume for all the screeners to set off volume surge alerts. This to me looks very much like a manipulated market. This is why I say be careful in these ETFs of the major averages. There's nothing wrong with making money with them on the long side, just know when the dance is over. The old saying comes to mind, "enter the trade slowly and exit quickly"

USO Update-

As you can see there's been no negative divergence to today's slide in USO, which is rare even in benign pullbacks. We are seeing some positive divergences develop here in the lateral range.

TSO Knocking in doors -up 8+%

Treasuries and the Market

Last week, I think Friday, I said I'd tighten up the stops or close the long position in TMV and the short in TLT (both slightly profitable on the latest trade-did even better in the first trade). Something is up with Treasuries and it could have a profound effect on the market. We all know that the Fed is manipulating the market but we also know that it is through treasury purchases. I don't know if the Fed is in the mist of a change of heart or the market is carrying a bigger stick yet to be wielded, but these charts are interesting and worth watching, especially in light of the earlier PIMCO turn-about and de-leveraging. It seems there's some uncertainty n the air.

Using TLT as a proxy for the 20 year, note the bullish wedge which is one of the reasons I began to grow skeptical of the trade. The wedge is accelerating recently. 

30 min 3C chart of TLT-a change coming? 


Now the S&P in green compared to TLT in red, there's an obvious inverse correlation. Also note that TLT is roughly near the April lows while the S&P has made significantly higher highs-a testament and proof positive in my mind of the Fed's manipulation of the averages in creating what I believe is a front, "The wealth effect"-the idea is just too ridiculous to be believed.

So if TLT reverses and heads up and the correlation holds, we may indeed be facing a market/asset bubble ready to pop. As I've noted, the market structure as it relates to liquidity, is severely damaged which would make ANY downside move as exaggerated and likely more exaggerated then the unprecedented single file straight march up we have seen in the market with almost and in some cases, no healthy bull market corrections. If any of this is close, then now is the time to have some dry powder, to watch any long positions, especially in the market averages or leveraged ETFs of market averages and now is also the time to acquaint yourself with the idea of short selling and to make sure you have a risk management plan in place that you follow religiously.  Even a quick look at past bull/bear markets, will show you it falls a lot faster, further and harder then it rises. And that's where your edge is in a downside situation, while most other market participants watch their gains turn into losses.

An Article from Our Boots on the Ground Member in the Mortgage Industry

He's been saying that people have been reluctant to take out loans on property as they fear they'll see a dip in the value of the home shortly after purchase and he's had a pretty good track record as this is his business and livelihood so he sent this article


I'm quite surprised we haven't seen anything from SRS, but there is a wedge there and I'm keeping a close eye on it. 

Here it is

This is called, pre-emptive regime preservation as Gaddafi fits the profile of the next domino to fall very neatly. So what does he do? The two things these trembling dictators can do, one through money and food to the peasantry (i.e. Kuwait) or seek to create a sense of extremist nationalism with the west as the obvious target- Gaddafi has opted for the second choice.

Here's the story and it was about as predictable as POMO days closing green. By the way, studies also show that Mondays have outperformed every other market day by huge margins. If you like those kinds of facts, buy yourself a copy of the Trader's Almanac. It's an indispensable cornucopia of market statistic, besides good charting software, this is probably the best investment of $25 bucks you'll make.

Back to the STORY

Market Update

For all of my Index traders, here's your fix-Please be careful trading these as they are the most manipulated of the ETFs, which up until now has been good, but recognize when the party is over-usually when they start serving coffee and I smell the beans grinding.

 DIA 5 min.

 IWM 1 min-the most manipulated of the averages IMO.

 QQQQ 5 min.

 SPY 1 min.

SPY 5 min.

There isn't a big POMO today so I doubt it will be of much consequence.

TSO is on a tear-up nearly 5% today

What do insiders know that we don't?

Waiting for the punchline? You'll have to email me one.

Any way, once again we have this week's insider transactions and the selling is hitting highs for 2011-for anyone new, this has been unabated selling by insiders to the tune of hundreds and even thousands of sales for every 1 purchase for a long time now. It takes time to cash out of a position for a number of reasons, options and when they are executable, internal rules, not wanting to spook shareholders, etc.

However, I always say this-"For all the reasons an insider may sell, there's one reason that they don't and that is "I think my shares are going to be worth significantly more""

So there was $21.4 million in insider purchases, NEWSCORP accounted for $20.2 million alone in one big buy so absent Newscorp, there would have been $1.2 million in purchases, compare that with selling of  $1.3 BILLION- not million as stated above for the buys, but billion.

As usual insiders and getting out. So what do they know that we don't? A lot!

EDZ/FXP Update

As for leveraged inverse ETFs, these are among my favorites. Just don't get lost in the lines as we used to say in painting/art-(kind of similar to the forest/trees analogy.
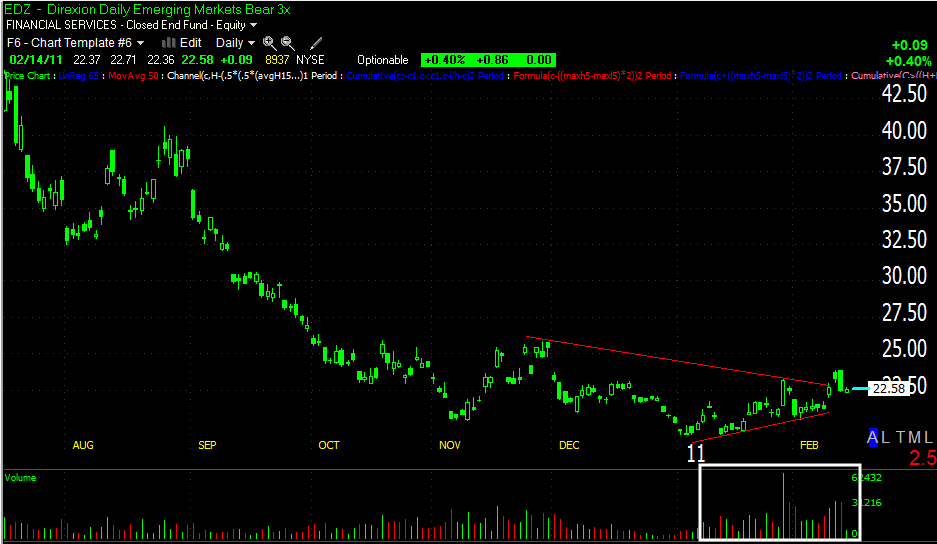
EDZ
 EDZ WITH A NICE BASE AND A FALSE BREAKOUT, which we see all the time with these obvious technical patterns. It doesn't mean it's not going higher, they're just cleaning some clocks before hand in most cases and the technical pattern tends to hold up after the shakeout.

 And here's the false breakout on 3C with a negative divergence at the breakout and test. (30 min)

 But we see a positive divergence suggesting accumulation on the dip.

 Our new indicator just for heckles and giggles. It did a good job of calling the breakout, the false breakout and what appears to be accumulation. NEAT huh?

FXP
 Step back from the daily gyrations and this is a strong looking chart.

 we see another false breakout and a positive divergence on the dip.

 1 min chart looks ready to roar.

Technically speaking, we haven't even pulled back to the 10-day m.a. so this is a shallow pullback. People panic though because of the leverage. You HAVE TO ACCOUNT FOR THE LEVERAGE IN THESE ETFS when determining your risk management/stop/position size. Otherwise you'll let a good chart's leveraged volatility knock you out of a technically sound chart.

Bottom line, this looks like normal or the "new normal" market behavior and thus far, I don't see anything that would run me out of these positions.

EMMS Long Trade Alert.

Yes it's taken off, no biggie-if this closes strong and on volume, we're looking for a follow through day. You can always set a tight stop just in case-THIS IS VERY SPECULATIVE.

AND WE HAVEN'T MADE A HIGHER HIGH YET, SO TECHNICALLY IT'S STILL LOKING LIKE A BUY.

USO Update-Time to buy?

It looks like a pretty low risk, high probability area to be long USO right now...

 Before Tunisia/Egypt, USO looked to be heading down, events rapidly changed and it seems smart money changed with them. As I hypothesized, they aren't letting USO go up until they grab their shares-accumulate-otherwise it's a wasted rally. Here we see USO just break support, shaking out longs and now shaking out shorts today and hitting stops-this is the fuel of an initial move higher.

 15 min USO chart shows the positive divergences suggesting the dip was bought.

The 10 min and lower timeframes are in sync with the move. This looks like a good area with low risk to enter USO.

MVIS Set for a Breakout?

Looks that way-this is a C&D trade and although it' up 8%, it's not a lot for this type of trade as you know we easily get double digit days.

 MVIS breakout?

 Daily 3C
15 minute 3C

There's a gap around 2.20 that may provide some support for a possible stop just under the level.

YGE from 2/7/2011 has triggered long

Checkout TSO LONG from 2/2/2011 Feb. List

We are seeing another breakout move in TSO this morning, at least on the open. Anyone still in this trade, contact me for updated stops and situation reports.

What Does This Tell Us?

PIMCO's Bill Gross is widely believed to be inside the loop as it relates to Fed policy, he's made some pretty amazing predictions about Fed actions in the past that seem more insider knowledge then market sage. Rumor? Yes, but as the world's biggest fund, PIMCO is an economic policy setting entity in its one right and Bernanke would be stupid not to keep Bill Gross on his side of the fence, so unlikely? Not at all.

Looking at PIMCO's latest holdings we see a couple of interesting developments...

First of all their T-bil holdings (government related) has dropped off a cliff, this is a huge change for the fund. As I've been saying, it seems like something is changing in the market and fast. Could it be the Fed's actions are creating unintended foreign policy consequences that aren't exactly appealing? In any case, Treasury holdings have dropped way off and the chart appears as if they are not done selling.

Actually almost every class of holding has dropped way off except marginal increases in high yield and "other". Their cash position has increased to the extent there's a positive cash balance in their flagship account as opposed to the margin they had formerly been on. Mortgage securities and emerging markets for the most part are also trending down. It looks like PIMCO is getting out of MBS/Treasury, decreasing their overall exposure to the market (all classes) and de-leveraging.

Something is most definitely going on in terms of a radical shift in mentality toward various asset classes.  This is yet another warning that we are approaching some kind of a shift away from the crowd consensus-the "Buy the dipsters" and other self promoting market-mavens.

UUP/US dollar Set to gap up

With Egypt now out of the limelight, the fear cycle over Eurozone contagion has re-emerged and the dollar is trading up against the Euro. This is a longer term trend I expect to see continue for awhile.