Tuesday, August 21, 2012

Volatility

Not only traditional volatility, but the strength in the 3C signals is getting really impressive. Take a look at VXX (Short Term VIX Futures), it seems someone is making a big bet on increased volatility, which means the market goes the other way.

 This is our typical leading positive divergence in VXX on the 2 min chart.

 The area above is highlighted as the 13th, note the huge move in the leading positive divergence now.

 Here's a 3 min positive divergence.

 Here's the same period from above to the left (8th-13th) and look at the leading positive now.

 A typical 5 min positive divergence...

The same 5 min positive to the left (13th) vs today's super leading positive divergence. I might even consider adding some Calls to UVXY if we get a pullback.

The 3 Pillars and AAPL

Here are the 3 most influential "Risk/Rally-on" Industry groups (Financials, Energy and Technology) as well as the fulcrum stock of the market, AAPL.

This seems to give evidence to a small bounce as this rally has been intact long enough that its habitual, people are use to it, they won't give up on it that easy and are more likely than not, apt to see this as a "Buy the Dip" opportunity as not much is down by more than half a percent any way, especially the AAPL die-hard longs. Technically today is a big mess.

AAPL
 A 1 minute positive divergence, this is the fastest timeframe (except for Tick) and as such, the least influential, signals here are generally intraday, although the trend of this timeframe can be very useful. In any case it looks like there was some accumulation on a small scale in AAPL at the lows, this could be retail alone.

 Anchoring the negative character of the action in AAPL today is the 5 min chart, which doesn't sound that much longer than 1 min, but it is much more influential, as you can see, the move in to intraday highs was sold hard by institutional money, this can include short selling.

 The 15 min chart also is not only at a strong relative negative divergence this a.m., but also a steep leading negative divergence that started as AAPL ran to intraday highs.

The question in my mind is whether they run AAPL/the market up a bit as my initial gut feeling suggested as that would give traders some confirmation and more would enter the market OR if they just caught some more longs in the fly paper today and will just drop the hammer tomorrow on the open? As you can see, stops were hit around 11 a.m., but then there was some buying at the lows and again right at the 50 bar 5 min moving average-that's almost certainly retail.


 Energy 1 min fell off hard the last few days, I feel really good about the USO short/Puts.

 Energy 3 min, it's not coincidence that 3C deteriorates as badly as it does just as Energy breaks above resistance and 3C continues to deteriorate in a flat trading range.

 Energy's 30 min chart has transitioned clearly from price/trend confirmation to distribution.


Financials
 Financials saw a huge move in 3C on the 1 min chart today even among an already negative trend, this is a really extreme move.

 The 3 min chart did the same in to the last week, but it has been progressively worse the last few days.

 Locking in the downside, the 30 min chart is heading for new lows as XLF hit new highs, the spread on the divergence is huge and on a VERY important timeframe.

Technology
 Here's where it gets interesting, the 2 min chart just fell completely apart, I mentioned this yesterday about the strength of some of these 3C moves, today's was no exception.

 At the 3 min chart there's a positive leading divergence in Tech, that fits with AAPL pretty well. I've always said AAPL would be the stock to watch.

 Locking in the downside in Tech, the 5 min chart has gone from bad to worse to something almost indescribable. A lot of damage was done today, but it's the trend of distribution that really speaks.

Look at the movement in the 15 min chart in several days, all the way to a new leading low well past anything on the chart.

Thus, if we have any price strength, ti will be temporary and I'd use it to short anything I still want to get in to, I don't think they'll be much if any time to do this.


Might have found it

I might have found some evidence for the gut feeling I posted the last 2 posts, just as the Q's were showing something, there's something in Tech and AAPL, but on the other side of the coin, both are anchored down by worse divergences on longer timeframes, so for me, this is a very safe area to sell short in to price strength.

Charts coming.

TLT Flight to Safety Update

Earlier I posted TLT, "TLT Treasuries Coming to Life" because of several emails I had received, I said TLT was in good shape big picture and it looked like it was seeing strong accumulation intraday in to a soft patch or intraday pullback, now take a look.

 Longer term big picture, the break below support (head fake move?) shows a strong 30 min positive divergence.

Earlier the 1 min chart didn't show much until around 11:30 as it pulled back, it went leading positive and now we see confirmation as price joins 3C.

Not Great Evidence

Who knows, I could be totally wrong, it just seems to me there's a lot more volatility they could create, I wouldn't close any shorts based on a gut feeling, but just keep an eye out in case there is one and you may want to use it to your advantage to get better positioning.

As for the averages...
 This  1 min DIA positive could or may not be anything, there were others that were just noise today.

 On the other side of the coin, keeping the bearish momentum nailed down even if we do get a "gut Feeling" bounce, the 5 min leading deeply negative, even at the highs today.

 The 30 min is also turned down sufficiently to act as an anchor to prevent any bounce to do much.

 The QQQ 3 min is the best evidence i have found for my gut feeling.

 Holding down the other side of the equation, the 15 min leading negative and especially today, in other words, if we do get the bounce I had a git feeling about in the last post, it looks like you'd be well served by using it to short price strength as the downside turn looks locked in.

 SPY 3 min is similar to the Q's

 The 15 min is also similar with a strong leading negative divergence today.

 Commodities haven't sunk like the SPX today, that's a short term hint.

 Yields ar about in line.

 Longer term they are negative.

 The $AUD is not as negative as the SPX

 Yet as I posted yesterday, the $AUD is already signaling market trouble and the 3C chart for $AUD signals even more.

 The Euro also is not seeing the downside momentum the SPX is seeing, short term there could be some reversion to the mean.

Longer term, it looks like the reversal is locked in.

I'll keep looking.

Gut Feeling

I think today was an important break, but I am leaning toward thinking the psychological warfare isn't over; most traders think this is a pullback and many are buying in to it, a move up would suck many more in as confirmation. I get the feeling we will see upside before the next significant break down. I'm going to look around to see if there's evidence of such, if so, this would be a golden opportunity to position yourself in shorts you like on some price strength, a second chance if you will.

I'll report what I find.

GLD Update

I'm just reiterating, like yesterday with BIDU, GLD looks really nice here for a short or Put, I really like it here.

Market Update - A Different Perspective

I've mentioned that recently we've had some pretty extreme moves in everything, not just the averages, but I'll stick to those for now. If I wasn't aware of trend classification by price, I'd swear by the looks of the 3C charts, that we had entered the first stage of a real bear market at the May 1 top and the ride up from the June 4th lows was nothing more than a counter trend bear market rally, which is exactly what I suspected and still believe the BIDU move was. Obviously the market's price trend doesn't look like BIDU's, but the underlying trade looks exactly like a counter trend move just like BIDU.

 From left to right, BIDU Primary Uptrend (actually part of a stage 3 top), the area we shorted BIDU for the core short position ON A HEAD FAKE MOVE , Primary Downtrend starts, counter trend bear market rally, next: resumption of the Primary Bear trend.

While price in the averages makes it impossible to label them the same, the 3C underlying trade looks like that's exactly what is happening, this was our 3rd and final trend assumption; after a strong move up and head fake/bull traps were set, we'd move in to a primary downtrend or bear market.

I'll be showing you a lot of different timeframes, trends and activity (the actual flow of money in and out of an average during a head fake move-the mechanics of it) at highly probable bull-traps.
 DIA 1 min saw 1 leading negative divergence from the 16th/17th, today's is at a higher price and a deeper 3C low, making this an extreme move in 3C and a bearish one at that.

 2 min DIA Trend above a resistance level and at this morning's intraday highs, a sharp leading negative divergence in to price strength. This tells us what the move up was being used for by smart money.

 DIA 3 min at the same area, this is an EXTREME move in 3C, you don't see these often.

 DIA 5 min 3C leading negative today to a new low.

DIA 15 min chart with  relative negative divergence at today's highs, followed by an almost uninterrupted, vertical leading negative divergence on a pretty long timeframe that doesn't naturally or typically move that fast.

 DIA 4 hour, note resistance and the accumulation on Aug 2nd (this was seen everywhere we looked that day, it was market wide), the accumulation pushes price above resistance and from there 3C starts to go negative and then leads negative on a VERY long timeframe.

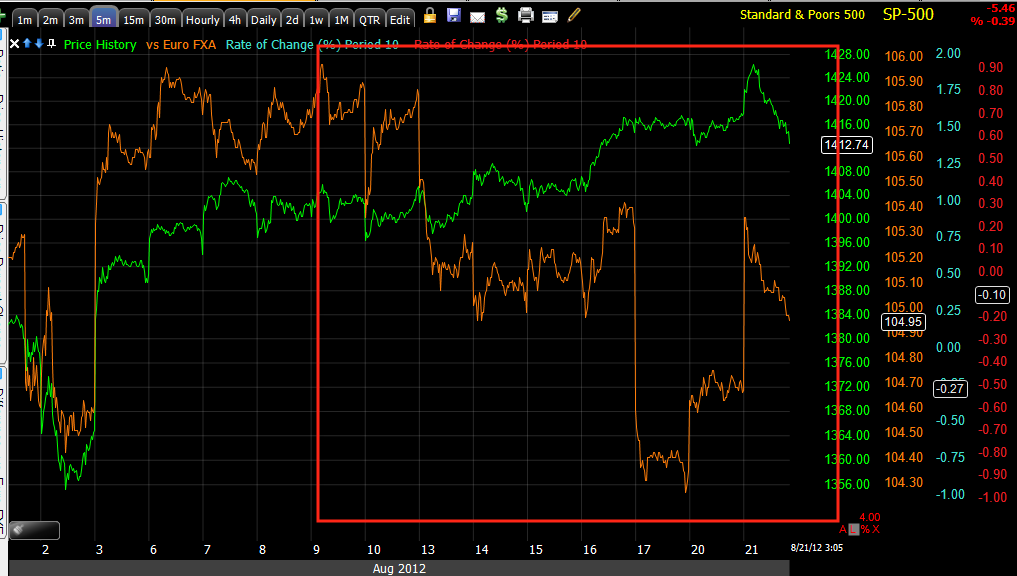
 ES 5 min showing the persistent negative divergence since yesterday as well as one of the sharpest moves I've seen in ES today , leading negative and to new lows.

 ES 30 min with a very clear leading negative trend and right where the break above resistance would be .

 ES 60 min

 ES 4 hour, shows the March-May negative divergence, the June lows positive divergence and the current negative divergence.

 ES Daily-confirmation of the uptrend from 2011 in to early 2012, negative divergence at that top where we entered core shorts and the current negative divergence in a leading negative position.

 IWM 1 min deeply leading negative, look at the 3C trend and the break above resistance.

 IWM 2 min , again note the trend line (white) and the negative 3C trend, no where near confirmation, as price passes the resistance area.

 IWM 3 min, confirmation with the Aug 2nd accumulation, a negative divergence in to the breakout above the IWM range/resistance.

 IWM 3 dy is pretty far out, but besides the smaller divergences and the larger calling the 2007 top, the 2009 bottom, the 2011 top that lost -20% in a blink of an eye and the current leading negative position, it's lower than the 2009 bottom! That's an extreme chart.


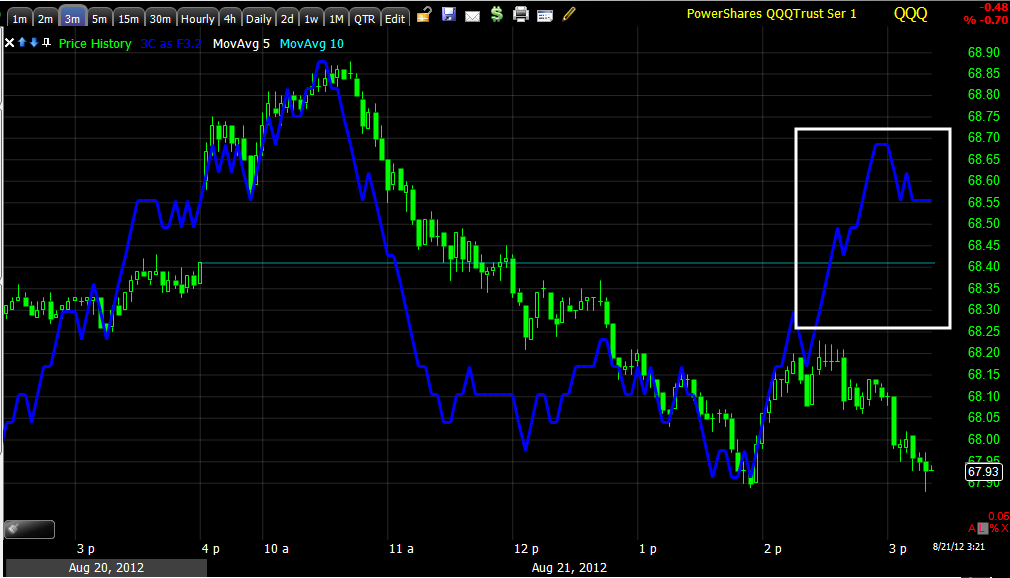
 QQQ 2 min leading negative and deeply today

 QQQ 5 min trend, note resistance again and the deep change in character, also remember how bad the NASDAQ Advance /Decline line has been in the same area from my breadth post.

 QQQ 15 min, same concept above resistance. Today's 15 min move is very sharp as well

 QQQ 60 min, downtrend confirmation, June low accumulation, uptrend confirmation and resistance broken with a leading negative divergence.

 QQQ daily, I don't think this needs an explanation.

 SPY 1 min with an extreme move the last several days.

 SPY 10 min with an almost uninterrupted leading negative move today.

 SPY 2 min also with a nasty trend and a deep leading neg. move today alone.

SPY 60 min , pretty self explanatory.