Tuesday, September 16, 2014

Daily Wrap

Today couldn't be forecasted much better from last Friday's (during the market) The Week Ahead

"While I can't pinpoint the exact moment, my guess is HYG is used to boost the market, maybe even our head fake move because the market itself just doesn't have the positive short term divergences to do it alone. However after that, I'll say HYG will be headed straight back down and I'm guessing this happens before the policy announcement on Wednesday. Judging by the scramble toward our set-up targets in several of our short set up plays today, despite a red market, it looks like they are in a hurry to get that move in place and I suspect HYG is going to help early in the week and then retreat before the market.

So rather than last week's "More of the same" sideways chop, I think the SPX's downtrend of lower highs and lower lows I have posted several times this week is a target for technical traders and HYG will likely sponsor the move"

This is exactly what has happened. Then our Important Market Update Post later Friday, with the simple..

"*If you miss everything else, don't miss the breadth indications near the bottom of the post."

This is because breadth had deteriorated so badly on a short term basis, a market bounce on a short term basis was the gist and thrust of all the breadth charts for near term activity this week, however, something much uglier stepping back and looking at the big picture.

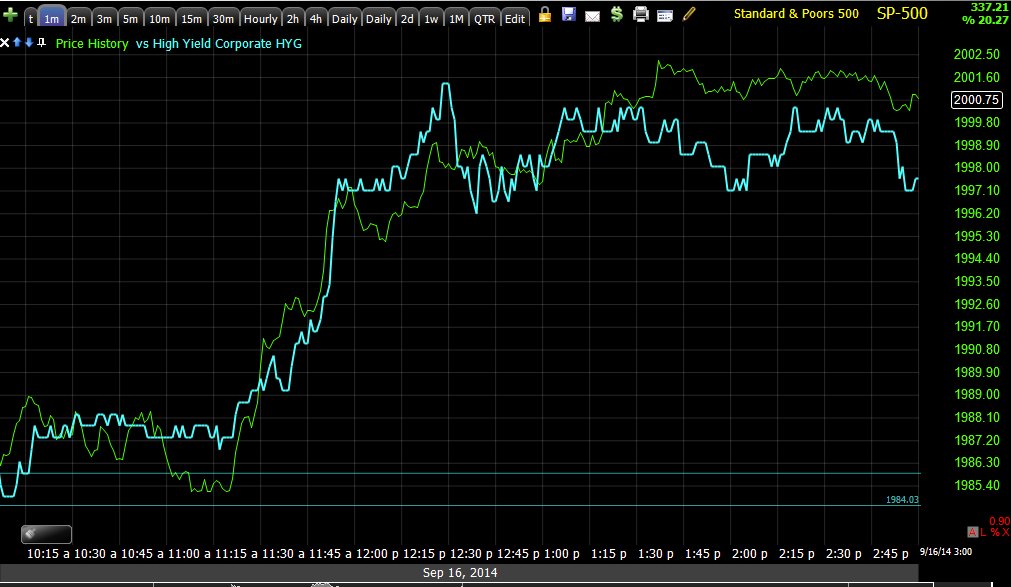
HYG led the move as expected just as it has led every move since late July with uncanny accuracy...
 HYG's lateral trend and positive divegrence which sent it higher, with some news from China so who knows if there was a leak or not, but the market was clearly telling us this was coming.

This is the intraday distribution already starting in HYG, although it still has a ways to go to take out the larger divegrence.

This is the SPY in green and HYG in red today, a near perfect correlation as expected for almost a week.

The AUD/JPY which gave out yesterday also saw leadership as Chinese QE was unleashed to 45 major Chinese banks (more on that), but $AUD is the currency that will react to China especially the dismal data coming out, make sure you see this morning's A.M. Update for more details on the situation in Asia and the horrible performance.

AUD/JPY (candlesticks) leads ES, but look near the end of the day as ES stays in line with HYG rather than AUD/JPY (AUD/JPY dips).

A great many of the stocks we have set-up plans already put forth are doing what we need or want them to do, for instance...
 After the recent decline on BIDU, I wanted to see a bounce for a better entry or filling out partial positions, we got that, at least a start today on a positive divegrence which is what the market ha been doing since yesterday just as BIDU has. However...

 We want to see higher prices in to weak underlying trade just as the BIDU chart (2 min) is showing (distribution in to higher prices).

Others on our list like SCTY...
Look ready for a move, however this is a small positive next to the negative and the longer term negatives making this an excellent entry opportunity, exactly what we were looking for not only this week, but conceptually from the August cycle's head fake move which we are still waiting on.As I said earlier , a F_O_M_C knee jerk reaction may get us there, but at the same time, beware of the knee jerk reaction as they almost always turn out to be wrong or faded.

The SPY even broke to our minimum target that will get bulls off their butts and chasing stocks, to distribute or sell large positions short, you need retail demand and the break above the channel mentioned last Friday in the "Week Ahead" post, was exactly what we saw today.

From Friday's post...

" I think the SPX's downtrend of lower highs and lower lows I have posted several times this week is a target for technical traders and HYG will likely sponsor the move"

And today's SPY move above the technical channel and on volume, EXACTLY what was needed to get technical, retail traders to chase and create demand.

Surprisingly, there was barely a short squeeze, or VERY week. Our Most Shorted Index...
The SPX in green pops today, but the MSI in yellow is really of no help at all. In fact, on a relative basis it's lower!

The HYG ramp and AUD support along with some helpful Hilsenrath/China headlines were still not enough to get the NDX or Russell 2000 green on the week. From a "Technical" perspective, there's been a lot more chatter about a R2K death cross in which the 50-day moving average moves below the 200-day. You may recall last night's post on the internals of the NASDAQ Composite as well as the Russell 2000, Daily Wrap.


The SPX hit 2000 but couldn't hold it closing at 1999, but we still have a possible (maybe even probable) knee jerk from the F_O_M_C tomorrow if Jon Hilsenrath actually has an inside line that the "Considerable Time" language or guidance really won't be changed which is partly what the market has been so concerned about going in to tomorrow's F_O_M_C policy statement at 2 p.m. Then we have a Yellen presser and to add more volatility and unknown factors, the Scottish independence vote Thursday.

As shown earlier in the Leading Indicators... update, almost no leading indicators supported this move including my newest Russell/SPX ratio, failing to confirm, HYG even gave out a bit toward the EOD holding the market back from ramping the close. While our professional sentiment indicators were looking ugly most of the day, they looked better in to the close which is one of several reasons (mostly 3C of the watchlist, the averages and HYG) that I think we have some more upside to go on this move.

As mentioned several times the last 2 days and as recent as last night , yields did do what we expected or rather the market closed in on them as we have used them for a long time as a leading indicator.
Here we have near perfect reversion to the mean as the SPX is pulled to yields.

Also as shown earlier, High Yield Credit (other than HYG) was not buying the move today, the environment is near perfect for entries in to our watchlist stocks (entry levels or alert price levels for many posted today, Here they are...).


The Legacy Arbitrage we suspect in the $USD seems more real today as commodities (shown last night) surged on a weak dollar today led by oil and coper. It seems more and more like the correlations and dynamics are returning to pre-F_E_D accommodative policy.

We had been seeing signs of a $USDX decline last week, today was the worst $USD decline since May, however, interestingly in front of the F_E_D, we have an interesting $USD divergence...
Today's $USD weakness is obvious, but interestingly there's a positive divegrence in to today's weakness in front of the F_O_M_C.

As for China's "Stealth QE", credited with sending the market higher around 11:30, around the time the Hilsenrath / WSJ story about the F_E_D not messing with the guidance timeframe vocabulary. I thought something was strange about that as HYG's correlation was much tighter and a bit earlier, it turns out the China Stealth QE has been announced during thee Asian session much earlier in the day!

In any case, China put out $500 bn CNY to the 5 biggest Chinese banks ($100 bn CNY each) for what I believe is a 3 month period as China's banks have been having liquidity problems. The last time China pr the PBoC did something like this, it was July 28th and used a new facility called the "Pledged Supplementary Lending" facility, in which China Development Bank was the recipient of a Trillion CNY! Here's how that QE episode ended if you're curious...
The Pledge of $1 trillion CNY to China Development bank on July 28th and the next two days ugly with the 31st seeing the SPX down 2%, which is the day in which all of the August cycle was first revealed in this post on the night of July 31st...Daily Wrap , Personally I think it's quite revealing and educational to go back and see what we were seeing when the future was the right edge of the chart, especially in the context of breadth which is one of the biggest factors to extreme market weakness just lurking below.

As for market breadth, one of the most interesting indications in the market and probably one of the most overlooked...

Dominant Price/Volume Relationship (this is not the relationship for the Index, but the component stocks that make up the index).

 As you might expect with weakness on the day in the R2K on a relative basis, there was NO Dominant P/V relationship. The NASDAQ 100 had a co-dominance of Close Up/ Volume Up and Close Up/Volume Down. I can't count this as it's not dominant. The SPX had 258 in Close Up/Volume Up and the Dow had 20 in Close Up/Volume Up, which were the only 2 Dominant P/V relationships. This is the most bullish of the 4 possible combinations, but often leads to a 1-day overbought scenario with the averages closing red the next day, however being a wild card F_E_D day and the fact it was not Dominant through all 4 major averages, I think I won't put too much stock in the reading, but in the days ahead, it will be important to remember.

Nine of Nine S&P sectors closed Green with Healthcare leading at +1.37% and Financials lagging at +0.43, however, this relationship is similar to the P/V (DOW/SPX) in that it often signals a 1-day overbought condition with the close the next day being red. Again, the F_E_D wildcard is a bigger issue.

Again on another (normally overbought basis), of the 239 Morningstar Industry/Sub-Industry groups I track, 190 of 239 were green. Any other day than the F_O_M_C tomorrow and I'd say we've reached a 1-day overbought condition.  This however is revealing, especially if we get an F_O_M_C knee jerk reaction tomorrow at 2 p.m. to the upside and have the same kind of breadth indications and some stronger negative divergences in HYG, the averages and our watchlist stocks as this would signify that what we have expected has not only come true to the letter, but is moving toward the decline/stage 4 phase, especially if the Market makes the head fake move in stage 3 of the August cycle.

This is the "Igloo with a Chimney" top I have mentioned so often, in fact as recently as today in the Asset List post with the chart from that post looking like this...
We already have the rounding reversal process, the head fake move is seen about 80% of the time in any asset and any timeframe, although the larger the technical price pattern and more noticeable as well as the more watched the asset, the more likely the head fake move which would put this one at a very high probability as we have been looking for it ever since HYG entered stage 3 and the SPX only a few days behind.


The SPX is getting a lot closer to it and HYG still has gas in the tank as do most of our watchlist candidates, it really comes down to a possible hawkish F_E_D surprise which may be difficult as the market has already expected a hawkish tone, which Hilsenrath threw some cold water on today.

A little closer to that "Igloo with a Chimney", which happens to be one of the best downside reversal timing indications we can ask for as well as setting up our Trade-Set-up entries at some better price and risk levels.

Finally, Market Breadth in our Breadth Series indicators. Stocks 1 Channel (Standard Deviation) > 40 day moving average (momentum stocks)  improved ever so slightly today by 4% points to 19 from 15% yesterday,  still well below the 2014 average of 55%.

Stocks 2 Channels (Standard Deviations) > 40 day moving average (real momentum stocks) improved by less than a percentage point, actually dismal performance and are in a world of hurt, this is the decay of the pier pilings those strolling the pier of price don't see.
It's not just the pathetic move today which is as good as n move at all (as the MSI showed no short squeeze of any value today), it's the bigger picture in the yellow area showing how damaged this market is, it's no wonder nearly half of the NASDAQ Composite and Russell 2000 stocks are in a technical bear market.

Stocks above their 40-day moving average improved from 34.68 to 39.17, another anemic move in the standard of market breadth, this down from an earlier 2014 average of between 70 and 80%.

There were no breadth indicators that showed anything interesting in repair on the upside today and the NASDAQ Composite's A/D line was virtually flat despite a gain of +.75% today!

In summary the Chinese Stealth QE is a virtual non-story except to point out what we already know from economic data and stock performance, they are hurting bad, why do you think the liquidity injection today went to the 5 largest Chinese banks and we saw how it played out last time.

The Hilsenrath story regarding F_E_D potential changes to forward guidance vocabulary may have more legs near term, but the street talk is still expecting a more hawkish F_E_D and could be disappointed if they do modify forward guidance.

From our perspective, we have been patient during stage 3, only adding short positions (and a few longs) when they had strong objective evidence. From here, it's just about letting those watchlist stocks make the move we hope to see and following the negative divegrence right in to our entry, so long as the market's divergence and HYG's doesn't fall apart first on a F_E_D wildcard hawkish tine tomorrow.

Remember, anything F_E_D related usually produces a knee jerk reaction that is almost always wrong, but it may be helpful in our case in entering some of these Trade Set-ups which I gave rough estimates of upside entry targets today.

We have caught F_E_D leaks a few times in the past, not that often, but when we do, they are obvious so I'll be watching the last 3 hours before the policy statement for any signs of such leaks as the media has the statement on embargo in advance so a leak is not that hard and the F_E_D themselves were caught red-handed leaking minutes almost 2-days in advance to major institutional players and private equity firms, 154 in all, almost 2-days in advance and by email!

As I've said many times today, SO FAR SO GOOD. We're right on track.


MCP Update

MCP is still hanging in there, it hasn't violated the support zone I've been watching and the near and long term charts are improving.
 This larger bodied candle has held all of the real bodies for the last 5 days which is what I want to see or a break above would be better, but for now, this is good.

The 1 min chart is flying.

As is the 2 min

And 3 min... the point being, the trend in the area , a flat zone that usually attracts accumulation is showing the right divergences and the right closes.

The 30 min chat is looking excellent and we have a decent reversal process (yellow) in place on this chart as well as the daily.

Leading Indicators...

We really could not ask more from our forecast for this week from last Friday, 3C has done what it should, HYG has done what it should, breadth is doing what it should and now leading indicators are doing what they should.

Taken altogether and shorting in to higher prices on this move is the answer all of these clues put out, which is what was expected to begin with.

 HYG v SPX intraday, this is what we expected, HYG to lead the market. We still have some upside room so I'm not calling this yet, but everything is moving in the right direction and I'm very comfortable that I have the bulk of my short positions filled out here and am very comfortable adding to them as they pop up.

 The new SPX/R2K ratio for confirmation is NOT confirming this move as you can see with severe weakness in the R2K, which should not be surprising with 40% on the Index in a technical ear market.


 Interestingly, Pro Sentiment which looked a bit better for an upside move today, is NOT confirming at all. Pro sentiment is going the opposite way.

The expected move to yields mentioned last night has been nearly on the nose.

And HY Credit is not buying this move...

Breadth Falling Out Here

In another indication of intraday distribution in to today's move as we have expected, TICK is seeing intraday breadth fall out with price...
TICK failed to make it up to the higher trendline as breadth gives out and more and more stocks tick down, now it has fallen out of the triangle which wasn't even an uptrend channel.

Expect some intraday market downside.

I'm looking at Leading Indicators right now.

Market Update... So Far So Good

Just like it took some time yesterday and this morning to build the market averages' positive divergences and more time to build HYG's, the distribution process in to higher prices has already started, I believe the technical break above the SPX's downtrend channel where volume rises is where bulls stepped in making it possible for distribution to start, as I said, START...  WE are not where we need to be yet and I wouldn't even dream of expecting it this early, but we are on the right track.

 This is the SPY 5 min divergence (positive) and it's in line so this would have to turn negative before we'd start considering this to be running out of gas.

Here's the minimum target to get bulls involved, a technical price channel or downtrend broken out of and volume picks up on the breakout meaning the bulls we expected to be lured in to the market on a break above that channel, have been. Wall Street doesn't do anything without a reason.

On the breakout, the SPY 1 min chart (new divergences always start on the fastest timeframes and migrate to longer ones as they get stronger),  is already showing distribution in to higher prices, that doesn't mean the process is over, it's really just starting, but things can move very fast and we still have the probability of a knee jerk reaction to the F_O_M_C which we suspected yesterday, but Jon Hilsenrath of the WSJ made it a higher probability today when he said that the "Considerable Time" language the market is so worried about, WON'T BE REMOVED tomorrow.

 The SPY 2 min is already seeing migration so this is a good start.

The 3 min chart is in line, migration or a stronger distribution process will show up on the 3 min chart next.

 QQQ 1 min is also showing initial distribution starting on the move higher.

The 2 min chart is seeing some migration as there's a relative negative divergence in place.

The IWM 1 min looks pretty bad, although this is only a 1 min chart, it still has work to do, but it looks like they are moving quickly there.

 For now the 2 min IWM is still in line with the price move.

 HYG is already showing signs of distribution and as I said last week (Friday), IO expect HYG will be the first to give out and continue to lead the market.

 HYG's 2 min is just starting to see some negative migration from the 1 min chart, but remember, this is the main line of support for the market as you saw earlier.


 The intraday TICK trends are obvious, there's some softness right now, but nothing horrible, just softness.

The NYSE TICK shows a strong move in the +1250 area, but it can't form an uptrend channel and the recent TICK data can't hit the top of the channel, that's likely the softness mentioned above as divergences are kicking in.

Unbelievably there was no short squeeze from the Most Shorted Index! I suspect that there are no weak hand shorts left, in other words those that are left are strong hands, institutional money and won't be squeezed,  still I'm amazed to see so little movement in the MSI.

I have a few more Leading Indicators and Futures to check, but so far, we are on track and have the move that we expected for this week started and the distribution in to this move we expected for this week also started.

This should provide some good opportunities, although I'm not going to make too many moves unless I just can't ignore the chart any longer, until we see if we get a knee jerk bounce from the F_O_M_C tomorrow, I suspect and have suspected we will.

Here they are...

As mentioned, most of these we either have a partial position or a full position in and they are near the top of the watchlist for a lot of reasons, largely long term deterioration and using short term price strength to enter at the best price/lowest risk. Here are some rough areas I'm setting alerts for each of these assets. Since the move is already under way, some of these alert areas have already been hit.

">" means "Above" and "<" means "BELOW"

Each of these will have multiple target levels, as they hit each one which I've picked for a specific reason, I'll be checking them and looking for the entry which will be price strength and short term 3C charts deteriorating in to that strength. All of these already have long term charts that are in the bowl and that's why they are on the list to begin with. Of course anything higher than my highest target is fine as well, so long as there's distribution in to the price gains.

These are the price alerts I'm setting to account for not only the HYG divergence and the divergence from yesterday in the averages, but a possible stage 3 head fake move on a F_O_M_C knee jerk reaction, this is why there are several levels, each are important to me for different reasons.

These are all short sale assets:

SCTY is a nearly filled out full size short  at a decent 7+% gain, although it really doesn't matter if you are interested in it as a new position, a partial position that needs to be filled out or none of the above.

I'm looking for moves or target areas in the ranges of > $70, $72.50, $75, $77.50 and $80


FSLR is about a half size position at a 2.5% loss which is fine, it's figured in to the risk management for a partial position when I'm looking to add to it at higher prices.

>  $71, $72, $73, and $74

IYT /Transports IYT short is already a full size position we recently added to and pretty much at break-even so it's doing fine. I like IYT right here for a longer term position short, although you might consider a partial position and add to on a move above my price alert levels below. You must include the phased in position in to your risk management before you enter. In other words, this isn't Dollar cost averaging to make a losing position look better in which you already have a full size position and add to it, adding unacceptable risk levels.

>$153.25, $153.75 and 154.50

COF is one recently covered as a Trade-Set-up with no current open position, I'm looking for a move in to the area of...

> $82.50, $82.75, $83.15

PCLN is a partial long term core short which has plenty of room to add to, just looking for the right bounce... Last night PCLN was mentioned in the Daily Wrap as a likely bounce candidate for today based not only on the wider expectations, but the hammer closing candle on higher volume.

> $1175, $1185, $1200, $1220, $1230, $1240, $1250

GM I just added yesterday as a Trade-Set-up, I like it as a longer term short and I like it here in this general area for a partial position, although while I'm expecting more upside I'd prefer to wait on it or only open a partial position and leave plenty of room (50%) to add at better price levels, so my position size would be likely 50% or below for a partial position here in hopes of adding at better prices.

>$34.25, $35, $36, $37, $37.50, $38.15

AAPL is another longer term position trade, it's also another I like right in this area on a long term position trade basis. There's no current AAPL position open as of now.

>$101, $101.50, $102.75, $103.50 and $103.75

BIDU is another I like for a long term position play right in this area, but if we can get it at a better price, all the better. My alerts for BIDU are as follows:

>$219, $220, $221, $225.50, $227.50 and $231

XLF is one I like in the area, the target we were looking for since June was above $23 so the FAZ (3x short Financials) position is filled out now, but obviously I still like XLf short in the area or FAZ long.

> $23.65, for FAZ I'm looking for a move BELOW < $16 & $15.75 although I like it here.

XLK (Tech) which I also like in the area...

>$40.35, $40.50 and long TECS (3x short Technology), I'm looking for a move BELOW, < 13.25, $13.15 and $13

HLF is a long term short we've been holding for a bit at a +30% gain, I still like it, but it needs to bounce.

>$47.50, $48.50, $50, $51 & $52.

AMZN is a partial (50%) position, I like this one a lot on a long term basis like all of the above, however more ideal entries would include:

>$334.50, $336.25, $337.50, $341.50, $346.25, and $350.

FB is another I like in the area, after yesterday's decline/break of the August cycle's trendline, I'd like to see prices around...

> $76.50, $77.25 and $78.50

As for shorts that are inverse ETFs such as FXP, I'm looking for alerts BELOW...
<$47, $46.75, $45.75 , $44.50 and $44

And BIS (3x short NASDAQ Biotechs) which we already have an approx. 2/3rd size position in, BELOW...
<$12.50, $12 and $11.70


Asset List

It's hard to know whether the market is front running inside information such as China's  $500bn yuan QE announced at 11:30, a little after the SPY had made a breakout move, but almost perfectly in line with HYG. Perhaps HYG was reflecting inside information. PErhaps it's just a happy coincidence which I doubt, but it's exactly what we were looking for Friday afternoon in The Week Ahead as well as the follow up, Important Market Update.

From the "week Ahead" post Friday afternoon...

"While I can't pinpoint the exact moment, my guess is HYG is used to boost the market, maybe even our head fake move because the market itself just doesn't have the positive short term divergences to do it alone. However after that, I'll say HYG will be headed straight back down and I'm guessing this happens before the policy announcement on Wednesday. Judging by the scramble toward our set-up targets in several of our short set up plays today, despite a red market, it looks like they are in a hurry to get that move in place and I suspect HYG is going to help early in the week and then retreat before the market.

So rather than last week's "More of the same" sideways chop, I think the SPX's downtrend of lower highs and lower lows I have posted several times this week is a target for technical traders and HYG will likely sponsor the move, however breadth and 3C charts are so weak, that's the time to use any strength as charts like FSLR and SCTY that are up today, are so VERY close to the targets they need to hit. That's when we want to get those positions, not that having them now is a problem, I'm just looking at the best timing."


Perhaps the 12-ish Jon Hilsenrath's 11:20-ish WSJ article (the unofficial mouthpiece of the F_E_D) hinting that the "Considerable Time" language will remain in tomorrow's F_O_M_C which would probably inspire a knee jerk reaction such as the one we have been talking about as a help to the market's current move.

In any case, as I have said, the move won't "look" easy to sell/short in to, but this is what we have been looking for on a longer term head fake basis and certainly on a short term HYG divergence basis.

 Here's HYG's divergence, 3C forecasting a move higher in HYG which is what we expected to sponsor the market bounce from Friday's deeply oversold breadth which continued right in to yesterday.

 Here's HYG vs the SPY (green) moving almost tick for tick intraday. Again, EXACTLY what we expected last week for this week and ahead of the F_O_M_C...

HYG and SPY again...

And here was the minimum SPY target, break the downtrend as that will get technical buyers in the game which you can see worked as volume climbed on the break through the downtrend channel.

On a 4 hour chart showing all of the August cycle and the stage 3 top, we had been expecting an Igloo with a chimney top, the chimney being a head fake move, we aren't there yet, but the concept says the probability is usually about 80% before a downside reversal (more serious than the downtrend channel).

So, thus far we have exactly what we are looking for and on some interesting news, perhaps more tomorrow if the WSJ's,   Hilsenrath is really leaking F_O_M_C information for them. Thus I'll be posting targets on the upside for assets that are right in the right area and position, some will have already been hit, but you can see that once you find the ones you are interested in.

As for the Chinese QE or stealth QE, the PBoC (China's Central Bank) will be providing $500bn in liquidity to China's top 5 banks through their "Short Term Lending Facility", each gets $100 bn yuan, this may sound like good market news, but the fact is, after the recent Chinese data (not to mention the Asian markets discussed this morning with the largest drop in the Shanghai Comp in 6 months), they are in trouble, this is more a bank bailout than anything else.

We'll get deeper in to the Chinese Bank bailout later and perhaps Hilsenrath's newest F_E_D rumors, but for now, I want to get some of those target levels out for assets /that have been either short sale set-ups, are current short positions or partial shorts as we have been waiting for a bounce to fill out the rest, they're on their way...


A lot of Trade Set-ups Coming Our Way

I suspected this move would be in to the F_O_M_C which is 2 p.m. tomorrow. So far we have a lot of our short positions that may be full size or partial looking for a better entry on the fill out, all moving our way. PCLN which was noted as having a bullish closing hammer last night and expected to run up, is among some of my favorite longer term short positions.

In any case, I'm running through the watchlist and I'm writing down some price alerts for assets on the watchlist we may already be in or in partial positions or are just interested in. As soon as I finish compiling the target price levels I'm looking at, I'll post them and you can keep an eye on some of your favorites as the market is giving us a gift, it's smart to use it.

Market Update

So far everything is still on track for a move described last Friday in the "Week Ahead" post as well as the after hours Market Update. The overnight Index Future action was pretty poor, but as expected, as soon as the cash market opened we were right back to yesterday's accumulation range. If I had to guess, I'd say we get 1 more chance to enter shorts on this bounce (although there will always be other bounces, this one likely offers the last best, low risk, excellent entry opportunity as recent entries like FXP have shown, a good entry is a good start and lower risk).

Using the SPY first as a general model and quick reminder...
 SPY 1 min intraday this morning with a positive divegrence at the opening lows, sending SPY higher and back to the accumulation range, maybe a bit too far as some light "steering" distribution or supply was let out to likely bring the SPY back to a very specific , lower range where accumulation is occurring.

 This is about the size of the divergence on a SPY 5 min chart, note there was none on Friday, it was really the breadth dynamics that hinted we'd see one early this week, but today makes the second day in a row in the same area, this isn't coincidence or random walk.

For a call option position I'd still want a price concession to lower premiums, preferably a sharp dip below red trendline support with positive 3C signals so I'll be setting some alerts for the major averages for a possible very short term, very speculative long piggy back play using call options, likely next week's expiration.

 As a reminder, this is the 4 hour 3C chart, by far the strongest underlying trend of anything above and the highest probability resolution. When Appaloosa said last May that they've been selling everything not nailed down for the last 15 mins, it's in charts like this that you can see their actions and these charts have preceded the breadth charts which I mentioned last night as being so bad that nearly half of the NASDAQ Composite is in a technical bear market and 40% of the Russell 2000, that didn't happen overnight, it didn't happen during the last 3 weeks or so of the stage 3 distribution area of the August cycle, this is an underlying theme that has been quietly carried out for a couple of years now while minimal new highs on no volume and no follow through keep the "Buy the Dip" long crowd drooling over the market with no idea of how fast things will collapse and just from experience, I'll tell you that even when they do collapse, this crowd has a near impossible time accepting reality and getting out, most won't get out until the market is near a bottom which can be a very long ride down in this instance.

 IWM intraday this morning also showing a positive divegrence at opening lows and a little pullback initially, there likely is a specific accumulation range.

 IWM 5 min is the divegrence for the move mentioned Friday for the "Week Ahead", judging by the size I'm guessing it will be used in conjunction with a F_O_M_C knee jerk reaction to the upside, of course as I always warn before these, "Beware the knee jerk moves up or down, they are often wrong".

 The Q's intraday show the same accumulation SAVE on the open this a.m. and a slight puling back from higher prices, keeping prices in the accumulation band.

 The QQQ 5 min has tracked the stage 3 reversal process top well, we saw this starting to move up last week. The bigger picture is still very negative, but this is like a interim move.

A closer look at the same chart...

5 min QQQ, most of the divergence is yesterday and today only.

TICK this morning is mellow at +/- 750 thus far.

And the overall SPY/TICK trend is obviously a big improvement over last week, despite breadth indicators collapsing even more last night, but the pace at which they are doing so has dropped way off since Friday.

 The Most Shorted Index (vs SPX) is still not showing any kind of serious squeeze, we'll see if it helps out.

And finally, as we thought last week, the sponsor of the move continues to be...

HYG with a 3 min leading positive divegrence over 4+ days now. HYG has led the market, 3C has led HYG. Once we have a bounce, I'll be watching HYG's 3C chart for distribution as I think they'll want to spend as little time as possible in HYG near a deeper stage 4 decline.


Off to individual assets...