Monday, October 31, 2011

Stella Got Her Groove Back

I think I'm going to open a proprietary gut feel news service...

Read this from the NYT

Here's some highlights...

"9:55 p.m. | Updated 
Federal regulators have discovered that hundreds of millions of dollars in customer money has gone missing from MF Global in recent days, prompting an investigation into the brokerage firm, which is run by Jon S. Corzine, the former New Jersey governor, several people briefed on the matter said on Monday.
The recognition that money was missing scuttled at the 11th hour an agreement to sell a major part of MF Global to a rival brokerage firm. MF Global had staked its survival on completing the deal. Instead, the New York-based firm filed for bankruptcy on Monday.
Regulators are examining whether MF Global diverted some customer funds to support its own trades as the firm teetered on the brink of collapse."
It sounds like margin calls were rolling in, Corzine or someone else (Corzine?) apparently met margin calls with customer account cash hoping to reach a deal and put it all right before any one knew any different, but the deal never came. This, by the way, IS ILLEGAL!
Did I say someone is going to Jail?
WHAT A WEEK AND IT'S ONLY MONDAY!

China PM prints at nearly 3 year lows

Whoa! And the day isn't even over yet. "Tower, this is flight Charlie-Hotel-India-November-Alfa coming in for a hard landing!"

PMI prints at 50.4 from 51.2 on consensus of 51.8! And those are the state released numbers-the actual is probably sub 50 or contraction. Not good for China, not good for the EFSF, just not good.

MF Global's Bankruptcy isn't the end, it's the begining

Today and last night I expressed concern that there was more to MF Global then meets the eye and that charges may be brought. Little did I know how on target I actually was off a pure hunch.

In MF Global's bankruptcy filing, there is a LOT of information missing. First, regulators can't get ahold of records or data relating to where their customer's money is and how it had been kept separated for protective purposes. Speculation is that MF is trying to protect either Corzine or other banks and primary dealers.

Reuters is calling MF Global, "Europe's biggest U.S. casualty to date" as well as the 7th largest bankruptcy by assets in the history of the U.S.

All we know now is that the SEC, the Commodity and Futures Trading Commission and the "FAD" are all talking-sounds a lot like Lehman in many ways.


Earlier I mentioned how other broker dealers were keeping MF Global employees and customers off the trading floor and locking them out, it seems they may have had a head's up to the back room drama we are just hearing about.

Stay tuned... This may have tentacles that reach a lot further then a run of the mill failure of a corporation.


DOW VS EUR Correlation

Here's the DIA and the EUR/USD in after hours.

 DIA AH

EUR/USD since the 4 pm close.

First off, they aren't on the same trajectory.

By the correlation that has been observed, the EUR closed at $1.3839 and at the time of this capture was higher by 13 pips, which equals (in correlated terms 26 Dow points) meaning the DIA should be trading roughly around $119.55, it's not a lot, but it would be higher then the DIA closed. For the past several weeks of watching this correlation, it's been pretty accurate. This is probably hardly worth the post, but it seems to show that there is a risk off trade in place and legacy arbitrages are essentially worthless, which is a huge change from what we have seen since October 4th.

As for the day open to close, the correlated move would suggest a loss of 330 Dow points, the Dow closed at a loss of -271. Since most of the day was spent lateral until EOD, I'd be curious to see if those extra points will be priced in.


Sustainability of the Risk Off Trade

One day sideways and one day down, (even a big day breaking important support) does not a trend make. So we have seen the cumulative effect of 3C building negative divergences suggesting a wicked move down, but confirmation can't be taken for granted and it can't be taken lightly.

To trade, there's a certain amount of ambiguity that YOU HAVE to live with, you can't trade otherwise, but what differentiates a trader from a gambler is knowing when you have the odds on your side.

One way to look for confirmation of a truly risk off trade is to look at the flight to safety trade, in this case since the PMs so far are back to legacy arbitrages, Treasuries are the obvious, most liquid place to park money.

Please go back and read this post from Friday if you didn't already. This was one of the early pieces of the puzzle that kept me and many others short through the uncertain weekend.

 If you read the article linked above, then you'll know that the 1 min chart above and the two min chart below both shows selling exactly where we should have expected to find it and accumulation exactly where we should have expected to find it. This is important confirmation if for no other reason then a way to calibrate the 3C readings.


 In retrospect, the accumulation was even larger on the 5 min chart, even early on the 28th.

 On the 15 min chart today, look at the leading component while prices were still relatively flat.

As for 1 hour volume, this s the biggest move we've seen since September.

TLT, the symbol used above is 20+ year treasuries. It's the closest I have to the 30 year and includes 30 years (at least that has any volume to it). Today the 30 year's yield dropped 24 and a half basis points which is the single biggest 1 day decline in nearly 3 years (remember the yield moves opposite to the price of the bond). With that volume, it looks like we just saw incredible rotation out of equities and in to the safety of treasuries.

Furthermore, I have to wonder if this will effect the "Fad's" thinking going in to this week's meeting. Usually they want to prop the market up, but since the repatriation of European capital (selling T's), you might wonder if the FAD doesn't actually welcome this event?

A few quick observations

 This is the 5 min SPY 3C chart, notice how today it was deeply leading negative, hitting new lows.

 Here's a zoomed in chart so you can see where most of the leading negative divergence occurred, during today's lateral movement. My take on this, as we saw a few averages and USO trying to or filling the gap, is that smart money or at least the middlemen (market makers on the NASDAQ and Specialists on the NYSE) went in to the weekend carrying supply, meaning they carried shares in to the weekend long thinking perhaps that a Chinese EFSF agreement would be likely. Realize both middlemen as market makers can be short and even naked short. The absolute breakdown over the weekend and the resulting gap down today would have left the middlemen and perhaps even some smart money, at a significant loss on the gap down. This is why they would try like heck to fill as much of the gap as possible and if they couldn't fill it, they would go as high as possible and get as short as possible to make the losses up on the way down. I think that is what 3C is showing us as it made the bulk of the move down during the flat period that lasted most of the day.

I also believe that after the Yen Intervention and the way the EUR/JPY was trading, everyone expected the correlation to send ES up to nearly 1300, when that failed to happen last night, I believe the reality set in that this was no longer a legacy arbitrage trade, but a true Risk Off trade and understood that the market was not coming back today.

 Friday we had the sym triangle which would have implied a break to the downside for technicians, but because Wall Street knows what technicians think, we see these false breakouts almost every time before a reversal and this one in yellow would have locked longs in over the weekend, which as you know, on a reversal creates a downside snowball effect with prices as we saw late in the day.

 This is the longer term daily S&P-500 chart.

 Here's a close up and what better place for a head fake then above the neckline of the top pattern, that alone is largely what drove Thursday's trade as traders will almost always buy a breakout that important, making it an area of great suspicion as we know how Wall Street operates.

 Ironically it is nearly the same pattern I used as a comparison last week back in 2008, the descending parallelogram, a break to new lows in March just like we saw that kicked off the biggest rally in the entire consolidation. Note the break to new lows was also a head fake used to create a stronger short squeeze as you recall, we were predicting that weeks before it happened and then a rally to new highs. In the 2008 case, just as now, the rally ended only after it crossed above the H&S top neckline-just like Thursday and then back down and we lost about 50% from there. That post may be worth looking at again as the same principles played out exactly, just on a longer timeframe in 2008. Emotion still controls the market in the long run.


Here's one last indicator, MACD on a monthly timeframe. If you judged by almost any indicator available on a normal timeframe, today would never have happened and the only reason I show this (and it was sent by a member) is because it thinks outside of the box by using a monthly timeframe. As for the reason the typical indicators didn't work, I'm 80% sure it was because of Euro repatriation as we have discussed at leeeennngggtthhh. The indicators couldn't give a solid read because there were no technicals in the market, it was a first in which the Euro was inadvertently being manipulated and computers simply didn't understand.

In any case, Friday night I pointed out the rare candlestick formation of a Harami Cross reversal, which is stronger then a regular Harami reversal, today would be considered confirmation of that pattern, but remember there are no projections of downside, just a reversal of trend.

3C has shown a huge amount of distribution/short selling and why wouldn't Wall Street do so at the best prices possible. So I'm guessing if this turn hold, we are going to see the worst drop we have seen since 2009. We are now below the neckline, trapping bulls who bought the breakout, Europe seems more upside down then ever. We have to see some confirmation selling and get through the FOMC this week which as I already explained, I think we will.

I'll be back with more charts soon, I will say I am mentally exhausted or maybe emotionally? Quoting Dr. Seuss is proof enough!

This is what you get

When you are a single currency bloc that has put ZERO thought in to how to deal with a crisis until you are given a 7 day ultimatum by the world to find a fix. 


I predicted, you probably predicted and just about everyone outside of the Finance Minister's meetings probably predicted that whatever you do for Greece- Ireland, Portugal, Spain and Italy (except Italy seems to REALLY need it) will demand similar concessions even if they have to lie or sabotage their own economies.


Where things took a real turn toward the SURREAL would be today when the instigator, Greece, turns its nose up at the whole deal. Even if Greece walks away, the cat is out of the bag and the other countries know that they hold more chips then the EU core ever realized.


So last week we heard rumblings out of Ireland not even 24 hours after the plan was announced. 


Next up was Portugal and their Mexican stunt.


Italy doesn't have to do much other then conduct bond auctions and the problems there are evident and REAL.


So there's only one more little piggy left (Greece doesn't count)-Spain.


Bank of Spain's GDP did not grow in the third quarter and there is a risk of not achieving the deficit target this year (sorry, you need Google Translate)

"The Bank of Spain said that the information available for the third quarter suggests that the pattern of decline shown in the previous quarter "would have continued in the middle months of the year, in an environment marked by the deepening crisis of sovereign debt euro area. "
Estimates from the conjunctural information, still partial and incomplete, indicate that "in the third quarter GDP would have been a no-quarter rate of change, bringing its annual rate of 0.7%," the report maintains."

"Current trends indicate the existence of risk of occurrence of a deviation from the deficit target of 6% of GDP in 2011, as a result of weak tax collection and spending of inertia, mainly in the area of the CCAA, "says the Bank of Spain.

The agency explains that "the magnitude of the deviation is within the margins that can be corrected through proper management of budget implementation in the remainder of exercise."

In any case, "if the budget execution data in the coming months indicate the likelihood of these risks materialize, it would be necessary to adopt additional measures in line with the unconditional nature of the commitment by the Government in meeting the fiscal targets and the close scrutiny to which public finances are subject amid the current sovereign debt crisis "

More or less in a nutshell, "Our 3rd quarter growth was ZERO. We are in danger of missing deficit targets for the year, which endangers our credit rating. " it would be necessary to adopt additional measures in line with the unconditional nature of the commitment by the Government in meeting the fiscal targets and the close scrutiny to which public finances are subject amid the current sovereign debt crisis" Translated as: We are the good guys who play by the rules unlike those other guys down south and we can implement further painful austerity measures which are sure to lead to riots in the street and demands by our citizens that we get the same fair treatment as Greece".
Or something like that. Another way to put it would be they state the very obvious, that which needs no explanation to drive home a point. If this were released 2 weeks ago, I think the wording would have been a little different and a lot shorter.
The truly ironic thing we are observing is that the EU made a hasty attempt to keep Greece from spinning out of control, a plan that was short on details, very short on cash, and not well thought out. Now Greece says it might not want to have anything to do with this plan and instead of having 1 beggar who has decided to be a chooser, the EU is faced with 4 more beggars who have the incentive and the means to get what they want. I said it last week, it is the PIIGS that hold all the leverage, not China.
With the way this week has started, I can't wait to see if Dr. Seuss is advising the FAD after flying over from negotiations in Europe.
A Few words of wisdom from the Dr.:
“We are all a little weird and life's a little weird, and when we find someone whose weirdness is compatible with ours, we join up with them and fall in mutual weirdness and call it love.” 

Stops

This is why it is generally a bad idea to place your stop with brokers and why it's generally a bad idea to put your stops right at obvious support/resistance levels-note the volume.

USO Seems to be Unwinding Now


Quick Venting Moment

I'm sorry, but I know almost every one of you personally and I'm sure you'll forgive my momentary rant. As traders you all know how isolating it is to sit in a room by yourself with no one to talk to and very few people who would understand what you're talking about anyway.

BUT HAVE WE ENTERED THE TWIGHLIGHT ZONE? Just think about what has happened the last 5 days or over the weekend or since last night or for the weirdest of all, today in Greece? What the heck is going on in Europe? Did the Finance Ministers that crafted this empty box of wishes to bailout
Greece, even ask Greece if they wanted a bailout and if so, what is G-PAP doing? To put the bailout to a referendum is to essentially say, "No thanks."

I'm having trouble digesting all of this and thinking about the "what ifs" when the current news is so much whackier then the possible what ifs of even the most creative minds!

Well, at least the market is moving somewhat as planned as of Friday night and the last several weeks, which have been a lesson in surrealism alone.

I don't think Salvador Dali could express this market in a painting unless he just threw random colors at random angles in every direction and then topped it off with cupcake sprinkles.

OK, I'm done for now. THANK YOU! I'll be checking in to Bellevue as soon as I wrap up this week's posts.

USO filling the gap


It sure looks that way, no one wants to be caught holding Friday's inventory at those price levels (especially the middle men) and then have a surprise downside move Monday.

 USO 1 min seems to be turning down now.

 5 min is inline still, but the way it goes is weakness in shorter timeframes moves to longer.

 Overall the 15 min is unchanged so it does appear to be a gap fill, this is a close up.


This is the wider view of the 15 min

 And the hourly

 Here's a total mismatch of any type of correlation whatsoever. (USO vs EUR)

And here's what looks like churning volume at a gap fill and some downside volume building in.

I just took a quick look at USO for changes since starting this post and it does look like the downside volume and price pace are picking up, making this a successful gap fill for someone.


Could today get anymore surreal?

The EU went through whatever trouble they went through, I imagine a lot of pepto, coffee, and immodium to get Greece "sorted out" and I suppose whether that is a positive or negative depends on which side of the Greek border you stand.

G-Pap has announced that he's pretty much out of this decision making process and is putting it to the people of Greece. You remember my post last week about Greek sentiment toward the Germans and EU at large?

Here are the bullet points from Bloomberg


  • PAPANDREOU SAYS NEW GREEK PLAN MUST BE PUT TO REFERENDUM
  • PAPANDREOU SAYS GREEKS CALLED ON TO CHOOSE ON COUNTRY'S COURSE
  • PAPANDREOU SAYS CALLS FOR VOTE OF CONFIDENCE ON POLICIES
  • PAPANDREOU SAYS GREEK DECISION WILL BIND ALL POLITICAL PARTIES
  • PAPANDREOU SAYS REJECT ELECTIONS AT THIS TIME
So all of this for nothing? I wish I could be a fly on the wall of the G-20 summit this week!

EFSF Bond Auction

For some reason I'm locked out of FT articles so I'll have to take it from another source.


"Europe, had been hoping to issue €5 billion in 15 year bonds to finance part of the Irish bail out via the EFSF. Instead, once seeing the orderbook, or lack thereof, Europe ended up slashing the notional by 40% and the maturity by 33%, to a €3 billion issue due 10 years from now. And that is hardly the end of the concessions. As the FT reports, "The bond from the European Financial Stability Facility will only target €3bn, instead of €5bn, and will be in 10-year bonds rather than a 15-year maturity because of worries over demand. A 10-year bond is more likely to attract interest from Asian central banks than a longer maturity."


"One banker said: “There is so much uncertainty over the EFSF that it will be much harder to sell than it was earlier in the year, when we saw massive demand from European funds and Asian accounts. Japan and China bought in big size earlier in the year. We are not sure we are going to see that type of demand this week.”

Bankers said the bond, which is expected to price on Wednesday, may struggle to attract interest in spite of Klaus Regling, thead of the EFSF, launching a charm offensive in Asia last week to encourage interest.

Already delayed from last week, EFSF officials decided to price this week because market conditions could deteriorate if they held off any longer.

The bond is expected to price at yields of about 3.30 per cent, and about 130 basis points over Germany, the European market benchmark. This is a big mark-up since the middle of September, when existing 10-year EFSF bonds were trading around 2.60 per cent and only 70bp over Germany."

Treasury Update (The Safe Haven Trade)

You might recall this post from Friday on Treasuries, if not I think it may be worth re-reading when you get some time.

Treasuries are a safe haven trade when the market doesn't perform well, last week we saw the start of accumulation in treasuries amidst some odd events.

Here's the current charts..

 This is today so you can see the inverse relationship between treasuries in green (TLT) and the SPY in red. Note the last dip in treasuries took place on an intraday bounce in the SPY.

 Here's the short term chart as this was a very fast change in character and shows accumulation Thursday and Friday as the article within the post implied. So far it's in line with a slight negative divergence which I think was that last bounce in the market.

 This is a close up of the same chart

 The 10 min shows what looks to be a consolidation sideways, but it's too early to say as it hasn't broken downward (3c), it could just as easily break upward.

Here's the 15 min chart, not only in line, but leading positive a little bit.

I think this post is most useful and informative taken with Friday's post.

AAPL CHART REQUEST

AAPL is another PCLN that people are itching to short, whether it's valuations, the loss of Steve Jobs or another reason, I get a lot of emails about shorting AAPL. In backtesting I did years ago, I found that best shorts were usually in the bottom 50% of sub-industry groups and for the most part, the stocks in the group that were the best candidates were in the bottom 50% of that industry group, in other words, AAPL is a strong stock and would likely be one of the last holdouts in a broad market decline so it's not a favorite for that reason alone. Secondly because of its weight it is used to manipulate the NASDAQ 100 and it is also a popular stock to buy and sell to balance ETFs.

Here are the charts...
 This is the 1 min hart for today, I know there are a lot of positive/negative divergences and confirmation signals (white, red and green respectively) so I numbered them in chronological order so you under stand how point 1 led to point 2, etc.

 The 5 min chart shows some weakness so intraday it may be something to keep an eye on although I wouldn't call it a strong short idea.

 The 15 min chart showed a negative divergence that sent AAPL lower, since then it has been largely in line (green arrows) with price so there's no real edge there.

 An hourly chart shows recent weakness in the form of a lagging 3C, pretty lose to leading negative, but there are a lot worse looking then this.

 As far as the long term trend, it's still relatively stable, although there was a break in red and in white it's starting to get messy and trade toward the bottom of the channel. I would be interested in AAPL on a decisive break below the channel, especially on high volume.

The current pattern in price looks like a right angle Broadening top, every H&S top starts as a Broadening top first and a hallmark of a Broadening top is irregular volume where as a H&S has a very specific volume pattern. Also a Broadening top usually has 5 major points of contact between support and resistance, the last one will try to reach the upper channel and usually reverse and fail about midway, I count at best 3 major points of contact here and a lot of potential support zones. Right now, this doesn't look like a stock ready to just drop in a parabolic move and shorting it could be very frustrating in a very choppy environment. You might consider the next move to the top of the resistance trendline as an area to try a short as risk is more minimal there, but still I wouldn't expect a large move just quite yet.

The EUR/USD and ES/Market Correlation

Since I was just showing you charts of this, I figure this post is a good follow up, especially in light of the very last chart I posted in the very last post.


"From a broad risk asset perspective, the intervention last night would have 'normally' suggested significant strength in ES (and other risk assets) but it seemed the risk-off sentiment was far greater than any correlation-driven strength and as the day has worn on, CONTEXT has leaked back (as risk assets in general have dropped back to sync with ES)."


Here are the CONTEXT models
The Red is where the SPY is, the Green is where the FX arbitrage suggests it should be.


This is the difference between the arbitrage model and reality, as you can see, the difference is narrowing. The point of my last post was there was a disconnect between the FX arbitrage which is the only real driver of the market as of late, as I said in the last post, it seemed like the arbitrage algos were shut down until I captured the last chart which showed the market finally moving back in line with the model, this maybe saves me the time of counting pips and figuring where the Dow should be.


Most importantly is the statement above that the intervention last night, "Should" have sent ES higher, however in a break with arbitrage last night, the market sentiment seems , or rather is as of now, in a risk off mode. So something is putting quite a bit of fear in the markets, I would guess it is the EFSF's empty box.

Italian CDS Spreads Widen

It's very strange that Italian CDS spreads have widened and are up 38 points which is about 9% considering CDS (which is the default insurance taken out by holders of sovereign debt to insure against bond losses) was pretty much declared null and void, at least in the Greek restructuring. They would seem like a worthless form of insurance given the EU's actions taken, yet today Italy's Credit Default Swaps are exploding to the upside.

So Italian bond holders are willing to pay 9% more for something you would think would be near worthless, they must really be worried about some events taking place in Italy.

Market Update

It would seem the legacy arbitrage algos are turned off this morning, USO showed signs of it and so do all of the averages.
Around 11 am The EUR/USD moved lower breaking the range  mentioned earlier.

 DIA, the red trendline shows where the Euro (red ) broke below the range, the green line shows how the averages are stronger then the typical implied correlation of 1.0, the DIA is the only one to have broken the earlier range. I'll have to figure out the point correlation to see where it is as opposed to where it usually would be, it may matter as the session progresses.


 The IWM has taken nearly a 2% hit, but still significantly above the range.

 The Q's are also above the range.

As is the SPY.

As I just went to grab this chart after writing the above, I see that the SPY is now breaking that range, the point of the chart was the 5 min has caught up by now and seemed to indicate that the averages were going to move lower, but  see that has already happened.

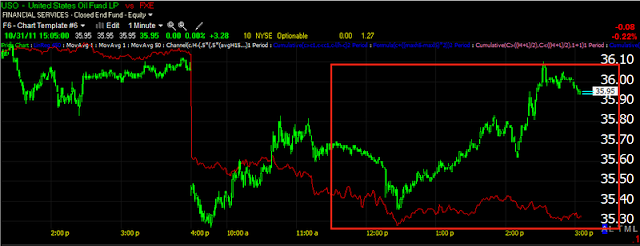
USO Update

 This is USO today vs FXE/Euro in red. As pointed out several times last week, USO had been running above the EUR/USD in which it has a tight correlation, but in almost every instance, the Euro was a leading indicator, meaning it would move down as USO held stronger like you see now, but then USO would drop to fall in line.

 The 2 min 3C chart showed an early positive divergence and USO filled part of the gap, you can see it still remains in line and will most likely continue to follow the Euro with bouts resisting as it is above and did last week.

 The 15 min chart has been negative on USO, I'm not sure still if it is an expectation of the Euro being overbought, something to do with Gadaffi, both or something else, but there was a great accumulation signal so the distribution signal I would assume should be just as functional with the caveat of the "strange behavior we've seen in the EUR due to repatriation of dollar denominated assets".

 The hourly hart has been even worse and note USO did break above a strong resistance level.

Here's that level on a daily chart, what USO does at that level around $35 will be interesting. A break of that level on volume should send USO much lower (at that point I would imagine the Euro would have also broken down as well as the market).

It's just another piece of the puzzle as the long term USO chart doesn't look much different then the long term market charts.

SLV Update

It seems to have been decided as to whether PM's were influenced by the dollar or were risk off safe haven trades. They've switched between both almost weekly for several months. Today they are effected by the EUR/USD.

Here's a SLV update for those considering buying weakness.
 The 1 min chart has worked well this morning with confirmation until 10:45, a negative divergence that pulled price back and now our second negative divergence, which should pull price back a bit, although it's not a very deep divergence right now.

 The 2 min chart suggests a deeper negative divergence, so lets see how this plays out, it's still not leading negative but it is negative.

 I believe late last week we spotted some early weakness or what at that point looked like a possible consolidation or pullback in SLV, here it is on the 5 min chart, it's a bit deeper then a regular consolidation, but it hasn't seen a LOT of damage today as of now.

 The 15 min chart is showing good confirmation on the way up-higher highs in 3C/price, until the sideways action started, this chart doesn't look as bad as many we have seen recently, but it is the one that is most concerning to me and what it does moving forward.

 Here's the crossover screen which I will be watching for any sign of a negative signal -it produced a buy signal last week. I am guessing at this point that a pullback would probably hit the yellow 10-day moving average, if this turns in to something worse then that, I would not consider buying SLV and I personally would wait to see what it looks like in that area (so long as things stay on this course which is something we can't have a high degree of certainty of with things as fluid as they have been in the last 48 hours.)
I offered this 60 min Trend Channel as what I saw as the only viable stop in SLV at the moment, that has been hit once it crossed below the red trendline. ADX has also turned down from 50+ which is not a great sign.

Bottom line for those who want to buy SLV on weakness, Patience.