Friday, March 16, 2012

The Averages...

First the dominant Price/Volume relationship because it has some connection to the Dow, all 4 major averages had a very dominant relationship of at least 40% of the 4 possible relationships (the Dow 50%) which was Close Down/Volume Up, in the current price configuration this is a bearish relationship, the Dow example will explain why.


 Here's the Dow-30 close, the closing candle is reminiscent of a bearish shooting star, either way the long upper wick is not good, it is a rejection of higher prices and the volume is the heaviest seen since the capitulation day that started the move up.

 Where did that volume come from? At 10 a.m. today you can make out a Shooting Star doji, it is a very bearish candle on its own and suggests churning (strong hands dumping shares to weak hands), this is where the huge volume spike occurred.

 The DIA's close was $.03 from a bearish engulfing candle and technically would be a very strong Dark Cloud Cover reversal formation, opening on a gap up near the highs and closing just a few cents off the lows.

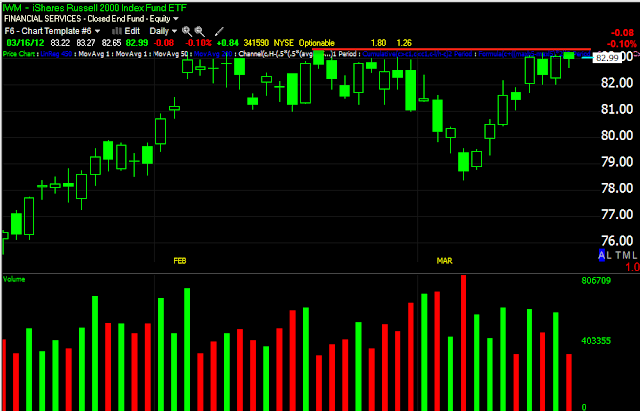
 The IWM closed below resistance as seen at the red trend line, although it seems (even in 3C), that it has been trying all week to break to a new high, which technically it did Tuesday, just not a strong break.

 At 10:00 this morning the IWM had its own bearish candle with a bearish engulfing candle as it briefly hit intraday highs and was rejected.

 The QQQ's after yesterday's Doji Star, put in a reversal confirmation candle today, although rather small, which is almost certainly due to options expiration.

 The SPY put in a bearish Harami and making it even more bearish, today's second half of the Harami pattern (known as mother with baby in Japanese) was a small bodied star, nearly a doji.

The SPY saw the same 10 a.m. Shooting star as the Dow, it briefly touched intraday highs and was rejected.

WMT Close

 We were looking for a Dark Cloud Cover Candle on the close or even better a bearish Engulfing Candle, we got the Engulfing candle. As a matter of fact, it engulfed nearly 3 days, just missing Wednesday by $.04 and on increasing volume.

 As for the Trend Channel break, it was just by a bit, but it broke the trend channel which is now starting to turn down.

Take a look at the hourly 3C since the head fake candle at the yellow arrow as well as Stochastics which were embedded until today.

We see a similar chart on the 30 min as well


In fact, a quick look at the options chain seems to indicate why WMT has been held above $60, although the next strike at $57.50 would have been a bit more ideal, options aren't the only consideration. If I had more time to watch WMT carefully, I may have entered a short position right near the close. There's always Monday...

Attack on Iran Coming?

USO intraday...

And the news...
Evaluation: Most of the cabinet for Iran attack


Eight ministers tend to support the position of Netanyahu and Barak for attack Iran, against six opponents. Cabinet members told the Knesset, Netanyahu's speech yesterday: "It sounds like a speech preparation for attack." A senior official: "The prime minister did not wait for U.S. elections in November"


A majority of the Israeli Security Cabinet votes to attack Iran and before US elections.

This week was interesting in the floated rumor of a release of oil from the Strategic Petroleum Reserves that was quickly denied by the White House, it seems they were testing the market's reaction. As mentioned yesterday, The USS Enterprise Aircraft carrier is headed for the region making 3 Aircraft carriers in the 5th AOR (there's usually never more then 2) and all within striking distance of Iran. Furthermore the US is sending more mine sweeper ships to the region.

Why Israel would make the vote public if they really intended to attack is beyond me, but the Israelis know that Obama will likely be less supportive of an attack after US elections if he is re-elected, before the elections he doesn't want to lose the Jewish vote so an Israeli attack before then makes sense.

While USO did surge,  +1.84%, BNO saw a bigger move of +2.92%. Presumably the bigger move in BNO is because of the underlying assets each represent. USO represents WTI crude or "West Texas Intermediate" while BNO represents Brent Crude. I think it's a given that Brent will rise more then WTI being WTI is made right here in the US and is a sweeter crude. Brent has a higher sulfur content and therefore is considered more "sour" which means it costs more in refining to remove the sulfur. Crude from the middle east for the most part is more sour, Saudi Arabian Crude is particularly sour whereas Libyan crude is sweeter. It takes 3 barrels of Saudi Crude (post refinement) to equal 1 barrel of Libyan crude and many refineries can't even remove the amount of sulfur in Saudi Crude, so whenever you hear that the Saudis will take up the slack with their "proven" but highly doubted reserves, it's not as simple as that. I'm not sure what kind of crude Iran produces, but it stands to reason that there will be a price divergence between WTI and Brent on an Iranian attack, although both should spike on an attack initially. 

We'll follow these developments, as I mentioned, why announce to Iran the outcome of the vote if there is real intent on attacking soon? 

I would guess that the price of gas is about to spike even further and of course that's not good for the economy, especially the European as the French are now paying $10 a gallon.


Israel Security Cabinet Votes 8 To 6 To Attack Iran

Pinned...

A very quick look at the SPY options chain seems like $140 was just about the perfect pin, at $141 there was another 113k in open interest vs 102k at $140. The $141 Put open interest was very small, if it closed below $140 the Put open interest would have been about 300% higher then at $141, so the pin makes sense at $140.30.


IRE Follow Up

IRE was a long trade idea from January 31st.

When presented, IRE was $6.27 for a 24% profit since. I never thought I would be putting out a long on an Irish Bank, but the signals were there.

 Here's IRE with a nearly 6.5% gain today, note the consolidation pattern and volume above the breakout level we were looking for (more on that in a second).


 3C has looked very good during the consolidation, this is the 60 min

 And the 15 min.

 Here's the breakout level and by the looks of volume, they have moved IRE from a stage 1 base to stage 2 mark up so I'm still bullish here.

 As for a stop, this is a 2 day trend channel that has held the entire move,.

 If you are looking for something tighter, the 30 min has held the recent move up

As has the 15 min, but I wouldn't go any tighter then this.

All in all, this one has performed very well, surprisingly.


AAPL at support

Resistance at Wednesday's close at the red arrow, support from yesterday's intraday hammer. AAPL sitting right at support.

UNG Update

I may add a little to UNG here...

 As you already probably know, UNG transitioned from a down trend to a lateral trend, hinting at a base. I have been of the opinion that the recent move below support , based on 3C readings has been a shakeout, there's no quicker way for Wall Street to accumulate shares then to get them on a shakeout as it doesn't raise suspicions as someone HAS to take the other side of the trade. Look at the volume since the move below support. While this is hardly a technical observation, I would note the Congressional plug that was slipped in for natural gas when Bernakacide was testifying before Congress, WHY IN THE WORLD WOULD A CONGRESSMAN PRESS BERNAKE ON NATURAL GAS AND ITS BENEFITS when Bernie has nothing to do with energy policy? However for financial types, it was like the Superbowl (as far as viewership) and the Congressman's plug, like a commercial during the Superbowl.

 Here's UNG today pressing resistance on a +3.24% move up today.

 Here it is intraday, again note the hammer candle and high volume was the basis for a reversal (that's just a mental note to put in your tool box). Volume near resistance is picking up.

 3C on a 10 min time frame is also positive and has the look of a bullish ascending triangle that wants to breakout.

Even the hourly timeframe went leading positive in 1 day.

Thus I may add to UNG in the area.

Credit is getting smoked today

First the CONTEXT Model for VIX and SPY


According to Capital Context's model, the VIX is still undervalued at these levels


 Their SPY Arbitrage Model shows the SPY as being overvalued here, the model is green, the SPY is red.

Now for credit, forget risk assets and sector rotation, take a look at this...

 High Yield Credit is selling off hard

 HY Credit hasn't moved higher with the SPX all week, in fact it has moved lower, but today's move is truly scary.

 High Yield Corp. Credit is doing the same, selling off hard.

It has been selling off ever since the breakout , but today is an extreme move.

Although probably none of us trade credit, it is an excellent leading indicator for equities.

More on the Triangles / ES

 Here's ES intraday today, you can make out a triangle in ES price on the 1 min

 Here's the ES  5 min

 And the 30 min

 ES 4 hour

 ES weekly

As an example of the negative divergences in the market averages that have been persistent (in ES as well as you can see), this is a breadth indicator I featured the other night, in green it shows the percentage of stocks that are 1 standard deviation ABOVE their 40 day moving average, these are strong momentum stocks, 2 channels above are really strong momentum stocks-all have fallen substantially.

 As for 1 standard deviation above the 40 day moving average, the percentage went from nearly 80% of all NYSE component stocks (well over 4000 stocks) to almost cut in half to 44%.

As an example, that percentage can't fall without the stocks falling as well, this is the first chart I picked so it's not cherry picked and it is certainly not been 1 standard deviation above the 40 day moving average, this would just be a stock that WAS above its 40 day moving average, the point is, for that percentage above to be cut nearly in half, nearly half of the NYSE stocks would look something like this, moving down and under their averages. They can't be strong and making new highs with the market if they are below the moving average they were formerly above earlier in the rally.

More on the Triangles, TICK

This is a purposeful or Wall Street created triangle, it's not a random pattern, it's not a consolidation pattern, it was put there and maintained there on purpose.

Look at the TICK Chart. As a reminder, the NYSE TICK chart is advancing issues per tick minus declining issues, usually it trends with the market and typically sees some extremes above + or - 1250.

You can see the triangle clearly in the TICK data, any time the market has seen some momentum on the upside , it has been shut down, the same is true of a recent move on the downside. Note there are very few extreme readings.

Now this could all be part of an options expiration pin, but in the past, those tended to be sloppy, undefined and generally lateral, I don't ever recall seeing a specific price pattern that traders would respond to.

Market update.

I should have posted this with the triangle post, since we know that triangles, especially noticeable ones like we are seeing market wide almost always get head faked... The only question is how long is the head fake out of the triangle? Intraday? Closing?

 DIA 1 min out of the triangle...

 DIA 5 min leading negative

 DIA 10 min leading negative

 DIA 15 min leading negative

 QQQ 5 min intraday positive divergence...

 QQQ 10 min leading negative

 QQQ 15 min leading negative

 SPY 5 min intraday slight positive

 SPY 10 min leading negative

SPY 15 min leading negative...