Thursday, September 27, 2012

Bottom Line on the Bounce

Hopefully this will be a quick presentation using futures, the averages and the Euro as a risk on currency.

 After nearly 2 trading weeks of moving lower , the market was in an oversold condition and primed for a bounce. The price/volume relationships that I track have been suggesting a bounce since Wednesday as the short term 3C charts have also developed favorable conditions for a bounce as well.

The break below the 13th's QE3 announcement area figures to be a key level as well.

First the Euro...
 The Euro 3C intraday charts show a negative divergence, granted it's only a 1 min timeframe, there were negative divergences in the Euro today out to the 10 min chart. These divergences halted all upside momentum in the Euro during trading hours.

Since the close, the EUR/USD hasn't been able to gain any upside traction. In fact it may be interesting to see how it performs tonight.

NASDAQ Futures
These saw an early positive divergence and later a negative 1 min divergence with some signals on the 5 min chart too, since the 4 p.m. close the divergence has grown worse and NASDAQ futures can't get a foot hold on any upside.

QQQ
 The QQQ chart, like the futures, was negative from 1-3 minutes, thus usually plays out the next day for these averages, I'll explain in a second.

 The QQQ 5 min chart just went negative as well.

ES (S&P E-mini Futures)
  After an early positive divergence in to the Spanish 2013 budget presentation, ES saw a negative divergence too, also on a 1 min chart, but there was evidence of a slight divergence on 5 min charts as well. Since the close as you can see, the divergence has grown deeper and ES hasn't been able to gain any upside traction either.

 Like ES, during normal hours the SPY went negative from 1-3 minutes as can be seen above.


The 5 min chart also went slightly negative.

Typically divergences on the averages like QQQ/SPY that we see at the end of the day, tend to play out the next day as if smart money prepared for the next day in advance, futures are a bit different, although the signals on the SPY/QQQ and others often will see confirming overnight activity in the futures.

I would expect to see the SPY, QQQ, etc pullback a bit and repair the damage on the short term charts and keep the 5 min chart healthy enough to continue the bounce/move higher, if that happens and we see some positive activity in to a pullback, then it will likely offer you an opportunity to take on some long positions to play the bounce/upside, however if price keeps moving up without repairing the damage to the short term charts, it's likely the 5 min chart will see more damage and it will continue to migrate to more important charts; in this scenario, the bounce will look strong price wise, but it will essentially be rotting from the inside out and it would not bode well for any kind of sustained move. If this is the scenario, the probabilities would be to short in to price strength/3C weakness for a resumption of the move down. I personally am leaning toward a continued bounce and an opportunity to add some long exposure to take advantage of it as the market is pretty oversold, but we'll have to let the market tell us where the probabilities are.

This is why I wanted to see both downside and upside post QE3 to see how the underlying trade reacts, this will tell us a lot more about what smart money is doing and whether QE was front run by smart money  for the first time which would likely mean they'd be looking to sell in to the policy that has all traders conditioned to believe the same thing about QE.

In any case, 1 bridge and opportunity at a time.


USO Has Best Day in Over Two Months!

Yesterday there were two posts covering USO and ERX (Bull Energy 3x) "USO / ERX Long".

Until I started browsing charts, I didn't even realize that USO had its best day since 7/19, over 2 months.

The charts suggesting a bounce in USO have been coming together the last two days, but yesterday looked to be the day as I mentioned USO and ERX as a leveraged Energy long (+4.34%).

I wasn't crazy about the intraday trade in USO, but held on to the ERX long. After looking at the charts for both USO and ERX, there's a decent chance that you may be able to pick one up long on a pullback and see some decent upside gains. The longer term perspective for both is unclear right now, but I'd think there's a very worthwhile trade in both if you didn't get a chance earlier this week or yesterday.

I'll use USO as an example as both charts are similar.

 The short term 1 min in both was negative today, worse in ERX than USO, so there's a decent chance of a pullback near term, that may offer an opportunity to get long.

 The 30 min chart in USO seems to indicate it has quite a bit more upside so getting long on some short term weakness would seem to be well worthwhile.

The 4 hour chart is still very negative, so long term USO's outlook doesn't appear to look good, but we are talking weeks at least I would think and the underlying trade may very well improve.

For now, I'd be on the look out for any price weakness as an opportunity to look at energy/oil long for a decent trade.

Yesterday's RIMM Long Trade Idea Just Blew to the Upside

RIMM After Hours Earnings....


Changes in character are what lead to changes in trend and the 3C change in character in RIMM has been significant.

Yesterday RIMM was highlighted as a longer term long position. Tonight RIMM is up at least +19.75% after moving up over 2% today.


If you didn't look at RIMM after yesterday's post, take a look at the post as there are several concept like the base support being broken rather than what Technical Analysis has to say as well as the clear divergences that make RIMM look like an attractive long term position.

If you didn't take on any RIMM shares, don't fret, I'm sure with a base that large there will be lots of opportunities in RIMM as we move forward.


Europe Coming Back In To Focus

There were quite a few events today from China to the US that were hot and cold, or negative and then positive. I'll cover the basics of what was important in a subsequent post, there are reasons things happened today the way they did to some degree.

In any case, as we've been slowly seeing the last two days with 3C and with dominant Price/Volume relationships as well as price action itself, the market has been putting itself in an area in which it first stabilized from the downdraft and then created some space to make a move (bounce) higher.

However, whether coincidentally or not, when the market starts focussing on Europe, bad things tend to happen. As Greece is pretty much a footnote in the history of the EU at this point, the dominant players are the ECB, Germany and Spain, today Spain came in to focus.

Spain presented their 2013 budget and on the whole it was well received by most, not by all.

The push of the 2013 budget could be summed up as budget cuts, however there were some plans that likely won't sit well with Spaniards who are already stirred up, one is the use of the pension fund to make up for shortfalls as well as an overhaul that won't be taken well by citizens.

The budget was also not taken well by one of the few credible rating agencies out there, Egan Jones who cut Spain from CC+ to CC with an outlook of C, or said another way, they just cut Spain to JUNK. The trade today was interesting and for sake of brevity, I'll simply use the NASDAQ and S&P futures as they lead the market any way.

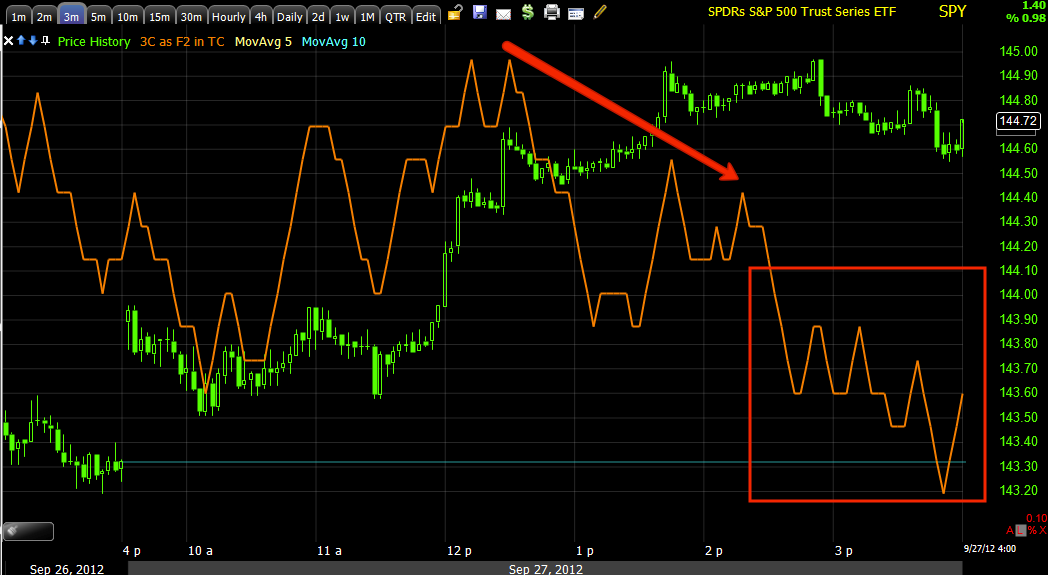
ES... (S&P E-mini Futures) 
 We see a late  morning positive divergence in ES and I can just about guarantee that was on the Spanish Budget presentation, but as ES moved higher 3C didn't confirm the move, but instead went negative and if you could see a Rate of Change on price you can see clearly that ES lost all momentum as that negative divergence developed (see the yellow area).

 On a 5 min ES / 3C chart 3C also failed to confirm the move today. It's difficult to say whether this was "Sell any strength", which I don't think it was as there's enough room carved out for a larger move up; or if this was related to Spain as the details were digested and perhaps even on early information that Egan Jones would be cutting their rating about 25 minutes before the close.

 ES moving along its daily VWAP's upper standard deviation.

 ES just hitting the weekly VWAP.

NASDAQ E-mini Futures (NQ)...
 As shown today, the NASDAQ 100 was easily the strongest average today in both underlying trade and performance. This 5 min NQ chart shows a positive divergence in overnight trade where volume is very light, during regular hours there's a small leading negative divergence, this isn't to suggest a collapse in the NASDAQ, it's just shown as an example of the failure to confirm which means it's likely strength was being sold today for whichever reason (as mentioned above).

 The NQ 1 min chart definitely lost momentum on the first relative negative divergence (the weaker divergence), but at the leading negative (stronger divergence), the NQ went flat with some downside bias.

 Here's NQ today at the daily VWAP upper standard deviation.

And like ES, NQ at the weekly VWAP nearly perfectly as it pulled back to the VWAP near on the close.

For Egan-Jones' part, here's what moved them to cut Spain to junk on a day in which many praised Spain for its 2013 budget and plans.

Spain's unemployment rate is 25% (50% for youth unemployment), E.J. doesn't think it makes sense to propose tax increases when unemployment is so high. Also Spain's planned use of their pension fund to fill budgetary gaps didn't sit well.

What the market may not like is Egan Jones' take that bond holders will likely face a Greek Style haircut, so much for all the promises that it was a one time event. Also Corporate bond holders in the banking sector are likely to take deep losses on the weak banks, while amazingly, the assets of Spain's two largest banks exceed that of Spain's GDP and with some other details, on that note they cut.

One has to wonder whether sovereign yields and credit in Europe this week which was weak, anticipated or got wind of the 2013 budget. As is usually the case, it will take the market several days at least to take all of this in and render an opinion, the sovereign debt markets/bond markets will react much quicker.

Market Update

Just as I put up the futures update, the next thing I see is ES and NQ start to crack, the EUR/USD is also under some pressure.

 EUR/USD 5 min chart

 ES 1 min chart

NQ 1 min chart.

There's no problem with the price action of the futures, the problem is in the underlying 3C action which suggests that the strength in the market was sold in to. Although these are only 1 min charts, this isn't the 3C action you'd expect to see for a consolidation/pullback or pause.

As for the market averages... The QQQ has been the strongest...
 The 2 min chart saw some damage today.

 Even the 5 min chart saw some damage and instead of being in a strong leading positive divergence as it was, it's now simply in line with price.

 The 10 min chart is still in line and looking at this alone I'd say there shouldn't be any trouble with the market continuing its bounce, the caveat is the weakness in the faster timeframes and whether that migrates over to this chart, if so, then the bounce will be more difficult to sustain and likely shorter.

 SPY 1 min saw quite a bit of damage, unless this turns pretty positive by the close, I'd be a little concerned about the bounce continuing tomorrow.

 The 3 min chart is similar to the QQQ 5 min as it has gone from a leading positive divergence to a leading negative.

Again, the 10 min chart for now looks ok to carry on with the bounce, but either there needs to be some more positive tone from these shorter term charts or they are likely to creep in to these 10 min timeframes and cut the move up short.

I'll obviously keep an eye on closing trade for any improvement. If there were to be shorter term chart improvement, it would likely need price to either pullback a bit or flatten out.

Futures Indications

Most of this week the NDX ha shown better 3C strength than the other averages, that was no more true than earlier today. We can see some of that in the S&P and NASDAQ futures.

 CONTEXT for ES was positive around the US open, since the model is negative vs ES.

 We see similar findings in the ES 1 min chart, about the time I said the market looked frothy, ES made its high and has continued to deteriorate on a 1 min chart.

 On the 5 min chart ES is not being confirmed as 3C is lower than ES, again that frothy look.

NASDAQ futures like the QQQ charts have been stronger than the rest of the market.

 Even now though the NQ futures are starting to deteriorate more.

On a 5 min chart there's a relative negative divergence so according to this chart as well as CONTEXT, it looks like the market is frothy and likely to consolidate back a bit from these levels.

I'll take a look at what's happening with the market averages as their divergences usually play out the next day whereas futures can play out overnight. I'll be closing half of the URTY trade from this morning, perhaps I'll add that half back, but for now it's a decent quick gain in a frothy market.

Considering A GOOG Position

Over the last several days there's been some ugly underlying action in GOOG whereas before it had been confirming the move up very well.

This is just a consideration, but in a sense, GOOG does remind me of the short entry in BIDU that worked out very well. BIDU had shown trouble in underlying trade and looked as if it were ready to break out. We prepared to short BIDU on a breakout so long as the underlying trade kept looking bad or worse, it did and the BIDU short (actually 2) were both very successful. The second BIDU add-to short had a similar event in which we shorted it on a false breakout as the underlying trade was deteriorating.

I can't predict the future of GOOG's price action, I can tell you there's trouble in the underlying trade and the set up thus far reminds me of several we have seen and traded successfully with an excellent price entry, very low risk and high probabilities.

Just so it's out there, here's the concept.

 Monday (orange) is not only where trouble showed up, but it was quite ugly, Tuesday was even worse (red).

 The 5 min chart which is all post F_O_M_C shows not only a relative divergence, but the leading negative this week.

 The 15 min chart which had been confirming on the upside also is deteriorating, that makes the situation mroe serious as the 5 min migrates to a 15 min chart.

 Now even the 30 and 60 are starting to show trouble as the 30 min makes a new 3C lower low which hasn't happened in this trend.

 On a daily chart, these parabolic moves are exciting, but study enough tops and you'll see that almost all of them start with an increased ROC on the upside or parabolic moves up, volatility grows and that tends to be a warning sign of a top coming. Since GOOG has made a very parabolic move, I'd expect any reversal to be more "U" shaped and not the longer inverted "W" shape, in other words, I'd expect it to top and decline faster than if it hadn't made such a parabolic move up.

Here's a potential trigger as a fairly large triangle develops with weakness in 3C charts, with BIDU we waited fro an upside breakout from a triangle and shorter that. If this triangle holds up, that is one scenario I'd watch for as technical traders will expect this to be a consolidation/continuation triangle and will almost certainly buy the breakout, creating demand for mart money to short in to.

That's a scenario, it may not be the correct one, but as of now it looks likely enough to warrant some price alerts just above the upper triangle resistance trendline.

Market Charts

This isn't to say that the environment for a continued bounce is damaged, it still looks pretty good, it' just intraday the spike in price is not seeing confirmation, therefore looking frothy.

For the time being, if this signal plays out and we see some more consolidation, it's simply an intraday signal, but we will want to watch if divergences continue through longer timeframes as that will be important information for positioning.

 DIA 2 min not confirming this area I'd call, "Frothy"

 ES 1 min not confirming either.

 QQQ 2 min not confirming and this has been strong all day.

SPY also not confirming, so far all on short term timeframes and intraday signals only.

Intraday market update

The market is looking a little frothy here, ES is giving a negative intraday signal, NASDAQ futures are right on the edge on a negative signal.

I'll get some charts up, but just wanted you to know in case you were running any short term trades.

AAPL Update

AAPL looks like most of the market as well right now so it's not only an AAPL update, but more or less the same as what was seen in the Euro and the market in general-consolidation.

 AAPL 60min chart with a bounce today similar to the market.

 The 1 min chart in line and then a relative negative divergence that has caused AAPL to consolidate sideways since it started.

 The same can be seen on the 2 min chart, looking a lot like the Euro, again since the divergences AAPL has just consolidated laterally.

AAPL with a 5 min positive divergence on the open this morning.

AAPL is still not a stock I'd consider a high probability long and I'm fine sitting it out, however it is  decent proxy for a large part of the market, especially the NASDAQ 100. As for longs to play the bonce, there were others that had much better signals in place such as the IWM this morning or URTY.