Monday, February 3, 2014

Daily Wrap

There are a lot of "headline" factoids in today;'s market performance such as the Dow and SPX (-2.07% and -2.29% respectively) have seen their worst start to February since 1982!

The NASDQ (-2.29%)  had its worst day in 8 months and the worst monthly start since they started keeping records.

The thing to really note here though is the change in character via volatility, remember those non-stop days making new highs on +0.10% or +0.22% gains, and now look at the volatility, not just today, but since 2013 window dressing ended, this is a change in character that can be added to the long list.

However, this wasn't an unexpected move, just like Friday Jan. 24th we predicted that last week would form a volatile range...
Last week's predicted range and with accumulation in it, the natural behavior of the market ids to post a head fake/stop run move.

Our "Come Monday" post from last Friday predicted that we'd see not only a break below that range, but that the move would be a head fake move, a false break down that would likely not hold and lead to an upside reversal.

If you re-read the post I included two links to two articles that are always linked a the right side of the members' site and that apply specifically to this situation, "Understanding the Head Fake Move".

The purpose of any head fake move and this would even include a bear market counter trend rally, is to swing emotion definitively to in one direction or the other so the move can be used to set up a completely different/opposite move.

To confirm a head fake move we need to be able to look at 3C/underlying trade and see if it is confirming the move (down today) or whether it is accumulating (in today's situation) and thus a true head fake move. So far today, we have good confirmation that this is a head fake move, a strong one and they need to be strong to accomplish their goals which can be found in the two articles I posted in Friday's "Come Monday" post which predicted today's move below the defined range of last week.

There are a lot of updates showing the signals we were looking for today, but here are a few just for a quick example.
 SPY intraday today with the tell-tale reversal process which is some form of lateral trade, whether a "U" shape or a "W" shape, just not a "V" shape as the market needs tome to accumulate the lower prices which make the head fake move work, again without reading the links provided Friday, it's difficult to understand, but once reading the links, it's easy to see why these moves are so frequent and so effective, how many longs do you think entered the market today?

The QQQ also today, rather than 3C confirming the lower lows by moving with price, it diverged positively (leading positive).

I figured we'd have at least Monday as part of the move. To me it looks like the process is about at the mid-way point, however the right side of the mid point usually has a lot more upside momentum than the left side of the "U" (the downside move). ***Remember that I said I think we are about at the half way point.

The IWM intraday has a leading positive divegrence too, this suggests that smart money was accumulating the supply that was either from stops being hit or shorts chasing price down, either way it creates supply that can be accumulated in size at favorable prices and the defined range from last week provided the area that stops and short orders would congregate.

This is exactly why I opened the GLD call late Friday as gold has been moving opposite the market and good thing I closed the GLD calls when I did today. around 12:00 for a +27% half day gain.
Any time after that, the premium would have just kept falling and profits with it.

There were numerous signals telling me it was time to close GLD calls, by the end of the day they looked like this...
 GLD 3 min intraday today going negative.

GLD 10 min today negative.

While this is not definitive on its own, this is the second Gold option trade this week, a put was closed for a nice gain Friday and the call was opened Friday expecting the market to be down today and closed today for a +27% profit and 22% on the previous position.

If I thought the market was not making a head fake move today, I would have not only likely held the GLD call, but I would have added to it or re-opened it later in the day, but that would have required positive divergences which were and are not there, suggesting GLD is going to see downside, remember Gold has been trading reliably the opposite of the market.

The real mover of the market has been the USD/JPY, we've known this for months and that's why we've paid so much attention to it and the components, the Yen and $USD, both were in line last week and last night for the market to make a move lower, but also using multiple timeframe analysis, suggested a move higher for the USD/JPY and the market via the Index futures was in the works.

First here's the USD/JPY and ES (SPX E-mini futures).

 First, a 5 min chart of the USD/JPY (green/red candlesticks) vs. ES (purple line). This morning I pointed out how ES was holding up better than USD/JPY, it's the first chart of this morning's first post.

Then ES caught down to the USD/JPY correlation later in the day.


This is a 1 min chart of the USD/JPY and ES, you can see they are correlated nearly perfectly, which means the weak $USD signals from Friday and strong Yen signals from Friday were predictive in what the Carry cross and Index futures (the market ) would do today, part of my analysis in the "Come Monday" post looking for a break below the range, but not only a break below, a probable head fake break below and as you see above, the intraday 3C charts show good confirmation that we were/are on the right track.

Today's long and call positions are hard to enter emotionally, but with a head fake move they are some of the best entries with the least amount of risk you can ask for, although it doesn't feel like that when entering the position.

Here's what we have now, keeping in mind that I said I thought the reversal process (unless it becomes a larger "W"  rather than a "U") is likely at least to the mid way point.

 The 1 min 3C chart of USD/JPY with confirmation on the downside and the start of a positive divergence late today.

USD/JPY 5 min chart with a clear negative divegrence near the highs on the chart and a positive divegrence developing near the lows.

If we could get better signals on the FX pairs it would make life a lot easier, but this is about as good as we get and rarely do we even get them this good, so we look at the components, the JPY and $USDX futures to get an idea of where the USD/JPY is going, thus the Index futures like ES and the market. Remember the $100 level (we are now at $101.9) is the Maginot line for the Bank of Japan before they step in and try to support the pair and keep the Yen from rising.

For the market to go up, the USD/JPY has to go up, that means the $USD has to go up and the Yen needs to move down. Today we saw the $USD weak while the Yen was strong causing the market to move down- try to remember those correlations.


The Yen single currency futures...
 This is the 1 min Yen chart, notice that during regular hours today it was headed higher right in to its highs around 14:52 at which point the intraday chart went negative and it topped.

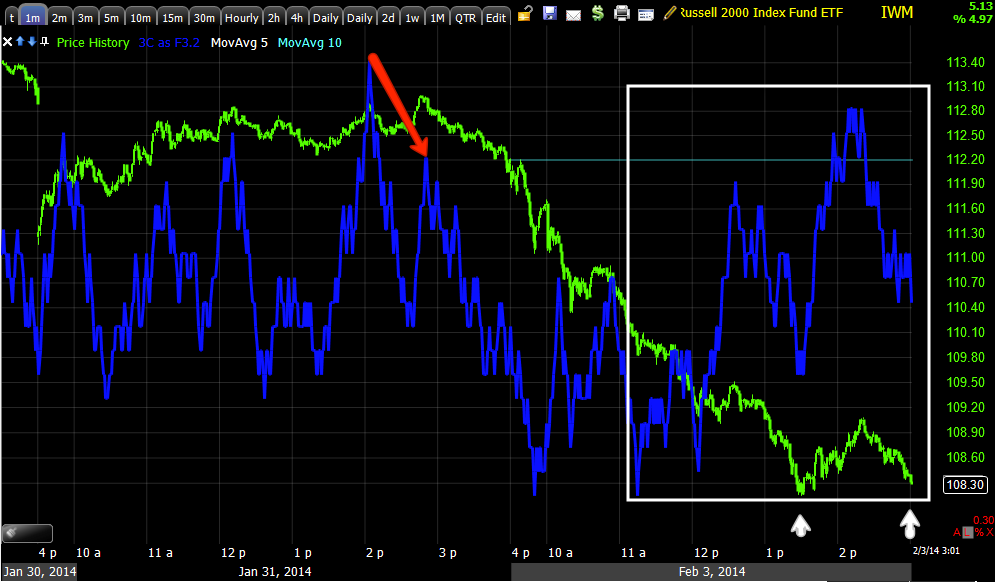
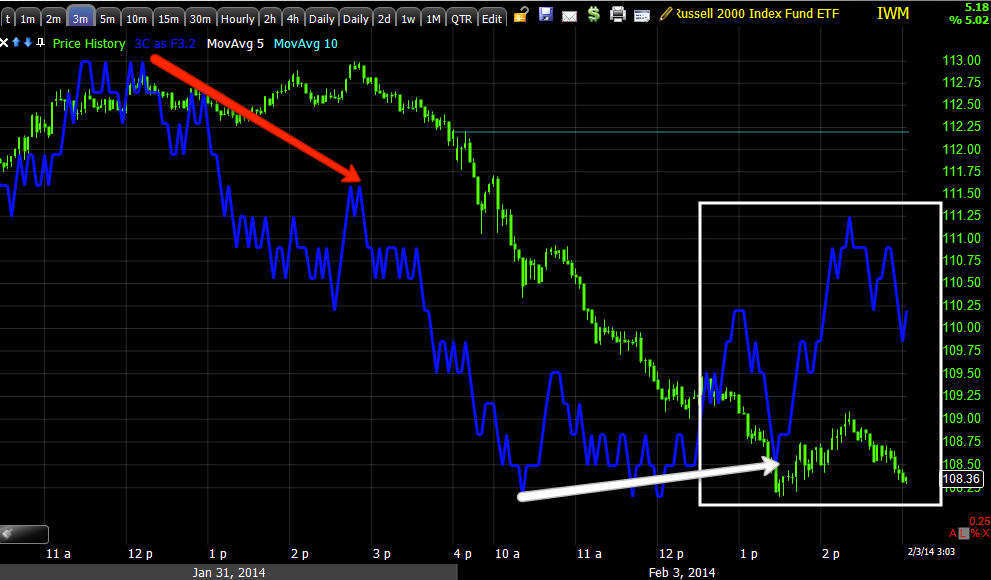
Lets see what the Russell 2000/IWM was doing at the same time.
IWM 1 min chart today, one thing the IWM wasn't doing was making a new low, you saw the positive divergences above.

 Here's a closer look at the Yen this afternoon to present, it has even dipped a bit since as it is now in a small leading negative divegrence and appears to have topped for the moment.

 The more important 5 min chart of the Yen shows a clearer, stronger negative divegrence around the same time, just remember, Yen weakness is part of what is needed for market strength, this is part of the reason our "Come Monday " post expected a move below last week's range.

The $USD is the other half of the carry cross, it needs strength to help push the market higher. This 1 min chart of the $USDX shows weakness in the currency which helped move the market down,  but there's a leading positive divegrence that has been in effect pretty much all day, this suggests the $USDX see an upside reversal which changes dynamics completely and may very well confirm our HEAD FAKE theory better than anything.

The 5 min chart of the $USDX shows the negative divegrence last week in to the highs, this is part of the reason we expected a market move to the downside/head fake downside move today, it was clear that the $USDX would see downside off that negative divegrence last Friday.

However, since then, we have a positive divegrence developing in the $USDX.

Even on a 15 min chart which was clear about a move in the market to the downside "COME MONDAY" via this negative divegrence, we now have what we expected to see, a positive divegrence developing at the white arrow.

If these divergences hold up and continue as the market averages did today, then the Yen should weaken and the $USD strengthen, pushing the USD/JPY to the upside and you know what the Index futures correlation is, they move with the Carry pair.

BELIEVE ME, I AM NOT BULLISH ON THE MARKET OVERALL, BUT NOTHING GOES STRAIGHT UP OR DOWN. WE'VE HAD THE FIRST DOWNTREND IN THE USD/JPY SINCE NOVEMBER OF 2012 SO THE MARKET IS IN TROUBLE, BUT IF WE CAN HITCH-HIKE SOME LONGS AS WE ENTERED TODAY AND LATE LAST WEEK AND MAKE SOME $ ON THE WAY, THAT SETS US UP PERFECTLY FOR ADDING OOR FILLING OUT CORE SHORT POSITIONS IN TO PRICE STRENGTH, BUT MASSIVE UNDERLYING MARKET WEAKNESS, IT'S A MARKET GIFT.

As far as the Index futures today (we already saw the market averages)...
 ES (S&P E-mini) 1 min from a leading negative divegrence in the pre-market hours to a leading positive divegrence and a reversal process in price as the day went on and continues.

 NQ (NASDAQ 100 futures) 1 min also saw a leading negative divegrence pre-market and pretty much in line until the afternoon when it started leading positive.

And TF (Russell 2000 futures) 1 min today, another negative pre-market, in line on most of the downside or trend confirmation and then a leading positive divegrence in a flat area where we most often see divergences.

These 1 min positive divergences area good start for regular hours, but the 5 min charts are what are really important so we need to see these divergences start to migrate to the 5 min charts and then we have something a lot more serious confirming today as a stop run/head fake move and setting up a bounce.

Consider the volatility of last week alone with moves above and below long term trend lines, a lot of volatility and today shows a lot of volatility so if we do get this upside move off today as a head fake, not only will today create a huge snowball momentum move, but the market's volatility alone could make this a pretty spectacular move.

The 5 min Index futures
 ES 5 min is already starting to lead positive.

NQ has gone from leading negative to in line which isn't a positive divegrence, but it's a positive development.

And TF 5 min went from a perfect trend confirmation to a leading positive divegrence.

Again, don't get me wrong, I'm not bullish the market by a long shot, but I do recognize the fact that we do get counter trend moves, bounces, head fakes and the such and if we can use them to our advantage in tactically setting up our strategic goals, then all the better.

As for some other confirming assets.
 This is the actual VIX futures, not spot, they have a 1 min negative divegrence, but on a larger timefame with larger distribution signals...

 The 5 min is very leading negative.

VXX (Short term VIX futures) is also clearly leading negative today on such a horrible day in the market?

The 2x leveraged UVXY has the same leading negative divegrence today as well, this "doesn't" seem to make sense.

SVXY which is the inverse of VXX and UVXY or short version is confirming with a leading positive divegrence today. These are 3 different charts, one leveraged, one inverse and two different funds, there's no way they'd give the same signals as the actual VIX futures as well as confirm each other if something weren't there.

On a day like today you'd expect to see a HUGE move to accumulate protection in VIX futures, but we see the exact opposite. Why? I think this comes back to exactly what we expected last Friday, today was a head fake move and although the correlation and skin deep action in the VIX futures moves up as it should, the underlying trade seems to show a rotation out of protection and buying the market on the cheap and with plenty of supply which is what institutional firms need in the size they trade unless they send prices against their trade.

We already saw what the GLD and gold futures charts said, I didn't take the GLD Puts /short today, but if I have time and the set up tomorrow, I may very well.
 5 min gold futures are leading negative

Intraday I closed the Gold calls opened late Friday in anticipation of a big day down in the market today, here we see the distribution that caused me to close the Gold calls rather than hold them.

The 10 min chart is leading negative in GLD too.

In the last week alone we've had a GLD Put that was closed Friday for a +22% gain and a GLD call opened late Friday for a +27% gain as it was closed today and one of the ways I determine whether to enter GLD calls or puts is where I think the market is going as gold has been moving in the opposite direction, these charts above would suggest gold moves down which would mean that market moves up and our HEAD FAKE THEORY THAT WE HAD FOR TODAY (the first part which is the move down came true, the second part which is 3C confirmation is largely true and finally the 3rd part of confirming a head fake move, the price moving back up is all we are waiting for and I think we have good confirmation thus far).

In addition, we have negative divegrences on the 1, 5 and 15 min charts of the 30 year treasury futures as well as the 10-year, I didn't go out any further because I don't need to. First this may give us the set up we want for a long term TLT long if we can get a decent pullback. However more pressingly for the moment, it would seem the same thing is going on in the Flight to Safety Treasuries trade that we saw in VIX futures, it seems there's distribution to rotate out of safety and in to risk for a strong upside bounce off today's move, if you read the "Understanding the Head Fake Move" articles I posted in "Come Monday" on Friday, you understand why today would create a very strong bounce to the upside, especially after last week's range.


This is the 30 year Treasury futures 15 min chart with a clear negative divergence suggesting money is rotating out of treasuries and in to risk assets for a market bounce which is the theory we've held now since Friday 1/24 when we expected a range for last week and that range with accumulation to see a head fake move as we see them 80% of the time before a reversal which in this case would be an upside move.

Some other indications...

Our Dominant Price/Volume Relationship has been working very well recently. Today we had a clearly dominant P/V Relationship of Close Down / Volume Up. The Dow had 20 stocks in this category with only 1 stock in the Dow 30 closing green, PFE at +.66%. The SPX had 344 in this category, the NDX-100 had 84 and the R2K had 1209, so we had a clear Dominant P/V theme.

Close Down/Volume Up acts like a 1-day oversold indication and most often the next day closes up.

My custom DeMark inspired Buy/Sell indicator gave a buy signal today to the Dj-30 and DIA.

As for Leading Indicators...
 Yields are one of our best leading indicators, you can se them go negative vs. the SPX in red and then the SPX gives up the ghost, however, they almost always revert to the mean before taking on a new direction, today both the SPX and yields reverted to the mean.

 Strangely High Yield Credit remains locked in the same range it has been in since the market started to range last week, because of the liquidity being so thin, this is usually the first form of Credit to panic and it hasn't yet, it seems like it's waiting for an upside move.

 HYG, High Yield Corp. Credit (As we say, "Credit leads, stocks follow") was underperforming the SPX today , but we saw the positive divergences in HYG, thus the HYG call position entered today,  toward the EOD, HYG not only got in line with the SPX, but started outperforming it in to the close. As far as the signals in 3C for HY Corp. Credit...

This is the intraday chart, I suspected once it hit around the mid point of the "U" shape 3C would start really leading positive as it does here.

There also is a longer term relative positive of some size, HYG's downside never was confirmed, meaning it didn't see the kind of distribution the price move implies, meaning it's probable HYG has been accumulated in to lower prices so I like the Call position entered there today.


Other than that, on a longer term basis in the Market Breadth Category, my indicators that look at all NYSE stocks trading above their 200-day moving average and 1 and 2 standard deviations above their 200 day moving averge all hit a new low tooday that goes through all of 2014, all of 2013 and to November 2012 lows. This is a very strong/negative breadth reading, but these have been deteriorating horribly since about April of 2013 as I have been documenting so when we move toward a serious market break (as in 20% in a matter of days), this market breadth is going to be a REAL problem as the market is hollow, even after the horrible 2014 it has had, YOU MAY RECALL RIGHT AFTER DEC. 27TH (WINDOW DRESSING) I SAID SOMETHING REALLY BAD HAS CHANGED IN THE MARKET'S CHARACTER.

So in the mean time, I think we are okay whether you chose to stick it out with core and even trading shorts, although I suspect we are going to see a very sharp upside rally/bounce that is going to scare a lot of people, IT NEEDS TO BE THAT STRONG TO ACCOMPLISH ANYTHING. However, this market has been broken for a long time and running on F_E_D liquidity which as we predicted back on September (19th) of 2012, was going to end as the F_E_D has made some clear changes to their language and started using subjective yardsticks to taper out of QE. What can be more subjective than the unemployment rate when the pool of available workers to be counted keeps falling (4 basis points at the last NFP in a month) as extended unemployment benefits ending cuts the work force by 3 million people this year.

Short term, watch the Yen for weakness and the $USD for strength or the USD/JPY for strength.

The only thing that bothers me immediately is the lack of a proportionate reversal process...
 Specifically today's move doesn't have a proportionate reversal process on the daily.

However, as a head fake move and a parabolic one at that, the accumulation would have largely been done in last week's range so there's not as much of a need for a reversal process and PARABOLIC MOVES TEND TO HAVE PARABOLIC REVERSALS AND A VERY SMALL REVERSAL PROCESS.

Looking at a 60 min chart of the recent action with the range and today, we have a high volume Star (bullish reversal candle) at today's close and with a parabolic move, if you follow the yellow line I drew in we have a nearly perfect parabola.

It would be strange to see the Nikkei lead (especially after the beating it has taken), but...
 The 1 min Nikkei 225 futures tonight are clearly positive with a flat range and I think this divergence had to wait for a US head fake move before it could do anything otherwise the range would have been much less effective in the US averages as an upside launching pad.

The 5 min chart has a strong leading positive in the NKD and note the immense volume, Changes in character lead to changes in trend.


I'll check the futures, especially the Yen and $USD before turning in tonight, but I feel pretty good with the calls and longs entered today and what we have.


HYG Charts

I'm not only going to show you the short term HYG (bounce/long) charts, but the bigger picture short as well as the bigger picture short is what the bounce is really about.

First remember that HYG (High Yield Corporate Credit) is one of 3 assets that are used as a lever to manipulate the market, the other two are VXX and TLT. The computers/algos read HYG up as institutional risk on and with VXX and TLT down at the same time (as we saw signs of in both today), that's an even stronger buy signal for an algo as they see HY credit moving up as risk on and the protection of VIX futures dropping as a rotation out of satey and in to risk and the same for TLT, a rotation out of the flight to safety trade of bonds and in to risk. Taken together this is the SPY Arbitrage and I wouldn't be surprised to see some of it active in a market bounce.

 HYG is one of the few that formed a bear flag rather than a lateral range. Technical (retail) traders see the break of a bear flag as a continuation pattern and they'll usually chase the downside break as they see the break as confirmation of the bearish price pattern, I don't believe in chasing anything; there are thousands of trades out there, why chase something and get a worse price position and much higher risk?

The head fake move articles explain how a century or more of Technical Analysis dogma has been used against technical traders ever since the Internet revolution (which is not as old as it seems) and since the advent of cheap online brokers where investors could make a trade for $7 rather than $80. I think it's pure laziness that led most traders to Technical Analysis, although I don't believe in Fundamental Analysis as everyone lies and there's no way to compare apples to apples and even if you could rely on the information and make a fair comparison, "Do you really think you have better resources and skills than Wall Street's well paid CPA/Analysts with every bit of known information on the company?"

The point I'm trying to get at is that I can predict how a technical trader will react to a price pattern like a bear flag, Wall Street has known this a lot better than I have for a lot longer and they have the advantage of the complete book so if you place an order with your broker, no matter what they say about it being private, Wall Street can see it. I don't know about you, but if I'm playing poker I'm not showing my cards to anyone.

A really simple way to force a short squeeze in an important asset like HYG as well as pick it up on the cheap and in size as Wall Street firms need to do is to use Technical Analysis against its practitioners, let them chase prices lower (shorting them) as it provides Wall St. with lots of supply at cheap prices to accumulate and when prices are pushed above the breakdown level (the flag), you have a bunch of retail shorts crawling over top of each other to cover, sending the position higher in a short squeeze, which attracts long technical traders as they see a failed breakdown and TA teaches, "If a trade doesn't do what it is expected to do, reverse your position". This is all momentum and snowballing that I talk about in part one of "Understanding the Head Fake Move".


 Here's the rounding process in HYG today as it broke below the bear flag, EXACTLY what I was looking for. Note also the positive divegrence in Wilder's RSI.

Here we have 3C divergences, positive today.

That divergence migrated, showing it grew stronger through the day.

On a 5 min chart, as predicted earlier, the second half of the rounding pattern saw a stronger signal in 3C, this one a 5 min chart leading positive.

It's still positive we get one more pullback to form a "W" base with today being the first half of the "W", but I don't think it's needed.

 The 10 min chart never confirmed the downside so price action moved lower than actual distribution, which is indicative of a head fake move as well.

All in all though, the 60 min chart of HYG shows a clear negative divergence, oif we look at even longer charts you can see something major went wrong around the May 22 2013 1-day Key reversal as Credit fell apart badly and NEVER recovered. So if I get the chance on a bounce in HYG, I'm looking for at least the gap to be filled around the $93.25 area and anything above that (>$94) is an even better entry (short) with less risk so I'll be watching HYG, HOWEVER THIS IS THE SAME CONCEPT FOR VIRTUALLY ALL RISK ASSETS.

WHEN THE LATERAL RANGE WAS CALLED FOR LAST WEEK, THE EXPECTATION WAS FOR A BOUNCE HIGHER, BUT THAT BOUNCE WOULD NEVER HAVE THE STRENGTH TO REIGNITE A POSITIVE/ PRIMARY BULL TREND, IT WOULD JUST BE USED TO SELL IN TO (IN THE CASE OF THE LONGS WE PICKED UP TO HITCH HIKE A RIDE HIGHER) AND TO SELL SHORT IN TO MUCH MORE FAVORABLE CONDITIONS AS THE ENTIRE MARKET FROM BREADTH TO CURRENCIES IS FALLING APART AROUND US, IT'S ONLY EQUITIES THAT HAVE PERFORMED HORRIBLY IN JANUARY THAT ARE NOT SHOWING THE TRUE DEPTH OOF DETERIORATION IN THE MARKET, BUT THEY WILL IN ONE FELL SWOOP.


Quick Update

I was just going through some different assets to see if there was anything I liked a lot, but had missed.

It would seem that Financials would have a high probability of moving to the upside with a broad market move, maybe thy would, but the signals for XLF long or FAS long are some of the poorest so I'm thinking that even if they did move, they'd have weak relative performance and I want to commit assets to areas where I have my best potential for returns.

Likewise, you'd think VXX and UVXY (short term VIX futures) would have a lot of weakness with a market move to the upside and while they do have negative divergences, I don't see them as being strong relative performers so once again, what is the point of committing dry powder to an asset that may not be the best return on your investment?

In the case of these two specifically, I think Financials are "Just that weak" and in the case of short term VIX futures (VXX or UVXY), I think that even with a market move to the upside and the typical correlation between them and the market being opposite, I suspect there will be a lot of traders looking for an opportunity  to purchase protection via VXX / UVXY at any discount, thus giving them some level of support and being poor relative performers as short trades in a market bounce environment.

I do like the major averages. As I said, I do like HYG, although I prefer options as the beta is just not that impressive there.

I will wait on GLD, although I was very close.

I also closed the AAPL calls early today which I'm happy with, but I had hoped to be able to enter them again on a pullback which we got, however I'm not that impressed with the signals from AAPL thus far. Don't get me wrong, I'm not saying it doesn't look decent, it just doesn't look as good as other assets like any of the market averages.

HYG charts coming up.


Trade Ideas: Leveraged ETFs (Swing Trade)

I think we are now close enough and in pretty good shape that I'd be considering leveraged ETFs of the averages like IWM, SPY and QQQ.

There are both 2 and 3x leveraged, I prefer the 3x leveraged like TQQQ, URTY and UPRO, but if you prefer less leverage, SSO, UWM and QLD would work. I think even a straight SPY, QQQ or IWM long would work, but I much prefer the leverage.

I'll let you know if I add to any, I already have TQQQ (3x long QQQ) and URTY (3x long IWM).

Trade Ideas: GLD Short

I think GLD as an equity short (I prefer 2x leverage, but the leveraged gold ETFs are fairly low volume). A straight short on GLD should work too, I'm just not sure the profit potential is worthwhile.

If I seriously considered entering another GLD options trade (the 3rd in a week), I think I'd take a March expiration put, but probably at about half the normal size.

Trade Idea: Options (HYG March $93 Calls)

I'm opening these now, I'll have some charts up soon.

Market Update

So far the market has not only made the price move expected today, but has also given the initial signals that move toward confirming a head fake move which is a big tactical advantage as failed price moves turn in to fast reversals although this would be a failed price move that was planned long in advance. Correlated assets such as VIX futures, Gold and some others (I still have a few to go through) are also confirming as is the price pattern which is distinctly a reversal process.

Here are the averages...
 IWM 1 min which looks like it's near the bottom of a reversal process. First there has to be a move that changes sentiment to bearish and fearful, then that move needs to be reversed which takes some time so my estimate was "At least Monday" and maybe a bit beyond. However it looks like we are near the bottom of what would be the "U shaped reversal process. In fact at this mini "W", I'm expecting to see 3C make a significantly higher move (the indicator) which would be perfect and that's where I'd be most interested in starting or adding to equity/ETF longs.

 IWM 2 min is showing less detail, more trend and at the bottom you can see the obvious change in 3C's character to the upside/leading positive.

We also see the same as the divergence migrates to longer timeframes like this 3 min

The 5 min chart going leading positive (which has started) is where I feel comfortable adding equity long positions.

The larger picture 15 min chart shows there's no downside 3C confirmation because the price move is more severe, there's very little distribution, just enough to get price moving down, once it is moving down, then accumulation should take over in to lower prices, this is the hallmark of a head fake move.

QQQ as mentioned earlier lagged as it had further to go before it broke below last week's range so no accumulation would start until that was done which it was at the yellow trendline. Again we have what looks like a small "W" pattern which looks like it could be the bottom of the downside reversal process.

 The 2 min chart is seeing migration of the positive divegrence so it looks healthy so far.

And the same is true of the 3 min chart

Now we are even getting the 5 min positive which is really the important crossroads, although I suspected this more than a week ago and so far it has played out so I can't say I'm surprised to see these moves confirming, but it is good to see.

 SPY 1 min with the same "W" pattern area. Even in a head fake reversal process, because the market is fractal, the small "W" we are looking at, at the bottom of today's "U" shape (first half) is likely to see a small head fake in which the second low of the "W" is lower than the first. This is why I say the market is fractal and these concepts are applicable to any asset in any timeframe.

 SPY 2 min migration and the rounding process.

3 min leading positive with the same process.

And here's the 5 min, at the second base of the small "W" which we are at right now, we should start to see the positive divegrence take on an increased upside ROC.

Even the SPY/Custom TICK indicator looks like it is transitioning too.

As mentioned earlier, Short term VIX futures move opposite the market and here the 1 min shows a clear negative divegrence which should be the opposite of the market averages in the same timeframe so this gives us confirmation.

If I were interested in a VXX put, I'd probably consider it in this area, as fas as a short position in VXX, I think we can give it a little more time and suffer no ill consequences.

VXX 3 min leading negative as well

And the 5 min. So far we have excellent confirmation.

There are a few other indications I want to check including leading indicators and FX signals.