Tuesday, October 23, 2012

FB now up almost 14% in AH

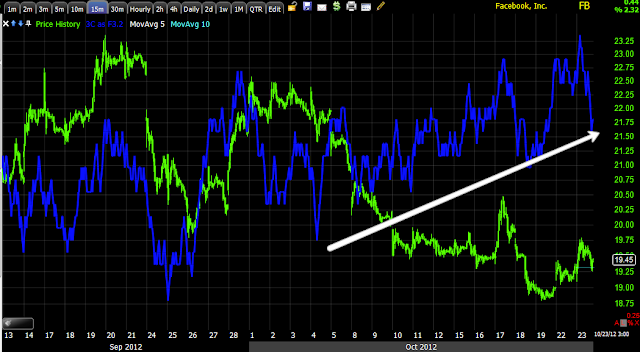
It's hard to see positive divergences like we have seen in FB and think that the accumulation wasn't premised on inside information, especially when bases are that big. When you consider they buy at the lows and sell some at the highs in a range to bring price back down and then average what they accumulated, it's hard to believe they aren't already at a large profit.

 The larger base with accumulation and distribution areas to send price lower, the chart below is the same, just zoomed in on the right side of the chart so you can see the details better.


FB is sent lower with some distribution at the $22.50 area, most accumulation seems to around $20 or so, that's a 10% profit overnight on what must be a huge position.

Re-Cap

Lets take a quick look at the market using the Institutional gauge of whether their orders where filled at advantageous prices or bad prices, if they didn't get a good fill on the average total of their position, it's not likely they'll be sending more business to that market maker or specialist and/or in house traders would have some explaining to do. Watch how the pieces fit together.

 Here we have last week's trade action with a weekly VWAP in ES. We had gone long in leveraged long ETFs and AAPL calls for the move up and as you can see the market or ES moved up and we were closing out those longs like AAPL calls on Tuesday at a +47% gain and Wednesday we closed FAS, TQQQ and ERX at small gains of 5-6% and , but they were still gains.

By Wednesday last week we could already see distribution was coming in to the market and by Thursday it was VERY clear and we were entering leveraged short positions for a move down in ETFs like FAZ, UVXY, FXP, etc. Friday the market fell, below you can see all of the signals that got us long and short last week. I actually thought it was a bit ironic that we were trading both FAS and FAZ the same week and making money on both.

 Here on the 10 min SPY chart we see accumulation before the run up and by Wednesday distribution was already clear, Thursday it was unmistakable. The recent longs entered late Friday afternoon and this week are in response to the next wave of accumulation which started late Friday after most options positions were likely already closed out (see below).

As the market fell on Op-Ex Friday, by late afternoon we could already see accumulation was starting (see above) which seemed like they were in a hurry to get started and not waste time; remember they need time as reversals and accumulation/distribution at reversals are a process, not an event. Last Friday afternoon I started opening partial speculative Leveraged long positions, you may recall I didn't want to open more than half on Friday and wait to add the other half at better prices. Some of the long positions included AAPL $615 November Calls that were closed yesterday for a 13.5% profit , I closed the PCLN short trade at a +26.5% profit and entered ERX, XIV and TNA  and before the close UDOW as well, all positions that are in preparation for the next move.


 Above is a weekly VWAP of ES, in the white area we saw the market pop on a Market Watch article that the F_E_D would be expanding QE3; this move threatened to break above the 2nd standard deviation of VWAP which is not an advantageous area to fill new long positions, ES had to be halted and brought back down. After hours yesterday at the red arrow Moody's gave the market the excuse it needed by downgrading 5 Spanish Regions as the Spanish Regions bailout fund has less than 5% left and the borrowing costs will rise with the Moody's downgrade for the Spanish regions. In essence, the Regions will need more bailout money, but Spain doesn't have anymore in the fund-THAT WAS ENOUGH TO SEND ES NOT ONLY BACK BELOW THE WEEKLY VWAP, BUT TO WALK THE LOWER 2ND STANDARD DEVIATION. This would be an advantageous area to fill long positions and I used it for that purpose today in filling out some of Friday's initial long positions as well as starting the Financial long position in FAS that I didn't think was ready on Friday as Financials did underperform and finally gave some signals today.


 Looking at the daily VWAP for ES, you may recall the positive divergence early today pre-market and in to the lows of the day, as ES moved toward the top of the daily VWAP we had already seen negative divergences today and expected some intraday pullback.  The net effect, ES was kept below VWAP where long orders could be filled.

Here's one of the many intraday signals we saw today that kept ES and the market from rising above VWAP and within the range. Also note the early positive divergence as most likely long orders were filled in the area.

In after hours so far ES looks like this...
1 min ES and weekly VWAP.

Today's 3C signals in ES, right now we are pretty much in line after the last negative divergence halted ES at the daily VWAP (see charts above).

The range we were looking for is starting to look pretty obvious in the Q's...

The positive divergences that we expected to see are coming along...

I can't say what ES will do overnight, but as we have seen so many times before, the Euro and Treasury signals that I showed you before the close today tend to be good signals for the market open/movement the next day.

I see FB is doing well after reporting earnings, I gave the evidence I had for an earnings based trade which was biased toward a positive reaction short term/on earnings and I gave the evidence that supported our longer term long position in FB and explained how these longer term signals themselves were predicting earnings reactions. I see FB is up over 10% in after hours, as I mentioned in the updates for FB today, earnings or not, the positive divergences we have been following there are enough for me to stay long FB.

I feel very good about our positioning over the last few weeks as we have been in front of the market getting some of the best entries. I also have a good feeling about our current positioning.

Last FB post

Would I call this an earnings trade? No, the signal is not as strong a the previous earnings trades, but it is stronger in some cases than earnings we have seen recently, but that may be more about the companies just not looking good, and 3C reflecting what was already known.

Here's the final FB hints of today, you decide if it's enough for an earnings trade, long term for the base, I'm still long FB and still like it.

 FB 1 min did seem to accumulate on that dip today whereas compared to Tech...

 Tech did not.

 However it didn't go further than that, the recent positive behavior in FB is more positive than the market.

Longer term there still is this very positive 15 min chart

Some Risk On Signals

I usually save this for after market, but there are several near term risk on signals I'm seeing, perhaps because of the F_O_M_C tomorrow, maybe just the move we are looking for in our evidence, but here are a few risk on signals I'm seeing in the near term.

In the fight to safety trade of Treasuries, specifically TLT, the 1 min DID NOT confirm the gap up today suggesting  a risk on signal, money out of safe haven assets and in to riskier assets like stocks.

 TLT 3 min negative

 TLT 5 min negative

 TLT 10 min near term negative

FXE
The Euro...

 5 min in a leading positive position on the gap down today.

 10 min also positive

$USD
 And on the opposite side, the $USD 2 min leading negative with no gap up confirmation today

 3 min looks even worse

As does the near term 10 min.

All of these are near term risk on signals for the market to see upside.

GLD /UGL (long)

Last night I covered Gold and showed there are some indications of GLD starting to take on a more bullish tone, the thing missing is the intraday or near term set up.

 I thought for a while that one of these head fake breakouts was going to lead Gold/GLD lower, the last one did. I also thought there were some longer term charts shaping up, but GLD would likely hit the $150 area before they really shaped up enough to take a long trade.

 As I posted last night, some GLD timeframes are looking pretty good like this 15 min

 This 5 min was the closest I could find to a near term positive divergence but this is more like a broad sword than a scalpel.

 The 10 min chart looks good here, so a lot of the near term timeframes are shaping up, but I'm missing the short term signal to go long.

 The 5 min Gold futures looks pretty good, but not the shorter 1 min

The 30 min futures look good as well.

I think I may have found at least a short term trade long Gold when I found some short term negative divergences in GLL (Ultrashort Gold)

 1 min

 2 min

 3 min

5 min.

Based on this and the longer term GLD charts shaping up, I'm going to start a long GLD position in UGL (speculative size for now) and see how it does.  GLL is the opposite of UGL so short term negative divergences there may just be the positive short term timing divergences I've been looking for in GLD.

FB Update

This is not an easy call as far as earnings go and I'm not sure whether or not there is an earnings call here, however there is some strange trade and I suppose the way it develops in to the close will be important for earnings if there is a leak.

Based on what I see right now, If I HAD TO GUESS, I'd say there would be initial disappointment followed by optimism. If the short term charts like 1-2 min keep developing, then there may very well be a positive earnings leak.

 FB 30 min positive, recently earnings have gone the way of the longer term chart's bias, think CMG that missed and fell, the chart there was horrible on the longer timeframes and I have seen a lot of earnings follow that path, this is partly why I think whatever the knee jerk reaction is, it will be followed by more optimistic trade in FB.

 The 15 min chart leading positive as well.

 Very short term this 3 min shows a negative divergence and FB falling a bit from it, this is very zoomed in.

 I see the same on the 5 min


  And the 10 min

 The longer term trend of the 2 min shows only a very small version of this, zoomed in it would look larger.

The 1 min chart zoomed in also showed it, but there has been a recent surge in 3C on the 1 min chart and if this keeps up, I can't help but wonder if this is a positive earnings surprise as there would have been a pullback and then aggressive accumulation of that pullback in front of earnings.

It is hard to call it aggressive when it is on the 1 min chart only thus far, but if it continues, then we may very well have something. Remember GOOG didn't give us any clues until 15 mins before earnings.

Tech and AAPL

AAPL unveiled some new products today, whether the market wasn't impressed or some profit taking occurred, in either case AAPL lost some ground. You know my opinion moving forward, if I had to take a position today and not touch it for 6 months, I'd be full-tilt short AAPL.

In any case, here's a look at Tech and AAPL which is to prepare you for FB, which I hope will still be showing an interesting signal by the update next.

Tech/XLK
 From the longer term 30 min chart with the start of a leading positive divergence and we'll work down, this however is impressive.

 10 min with a leading positive also, I think the range in Tech is pretty clear to see as it develops.

 3 min leading positive in Tech, also the range.


 The 1 min showed the intraday pullback like many averages and leading indicators, apparently it was more than just those alone, it was also AAPL.

 AAPL 1 min relative negative divergence.

However at 3 mins, there's no damage to the AAPL chart, thus far I can only take that as the move causing the pullback was not that strong of an underlying trade sell-off and AAPL seems to be recovering already.

Leading Indicators

From looking at the Leading Indicators I can see why there were intraday negative divergences and why the market has pulled back a bit intraday as the signals suggested in the last market update, however I can also see that the bigger picture indications that are part of this volatility shakeout/upside move that I believe we have been seeing the market prepare for since Friday afternoon, are still in place and there really hasn't been any damage done as far as that goes.

This is why I warn against getting TOO caught up in intraday trade or even day to day as you can rarely see the bigger picture unfolding right in front of you. 3C helps us determine what days like today mean for the market, for me based on what I've seen (evidence) the probabilities and signals suggested today's weakness was a gift I should take advantage of and I did in several areas. While the volatility of a range is near impossible to predict, it's the concept of the range or the process of a reversal. I don't think anyone could foresee the Market Watch article about the F_O_M_C's policy decision tomorrow and the ramping effect it would have on the market, however somehow that ramp had to be halted if there were to be continued positive divergences and I don't think we could have predicted the timing of Moody's yesterday (although I think it's not a surprise) nor could we predict how much the futures could be moved in low volume overnight trade, but the concepts still hold and as mentioned several expectations continue to unfold.

Now for the update.

 FCT which was brought to me by a member has been an interesting leading indicator, on a short term basis it went negative at last week's top with 3C, but it is also going positive as the PX pulls back from last week's top.

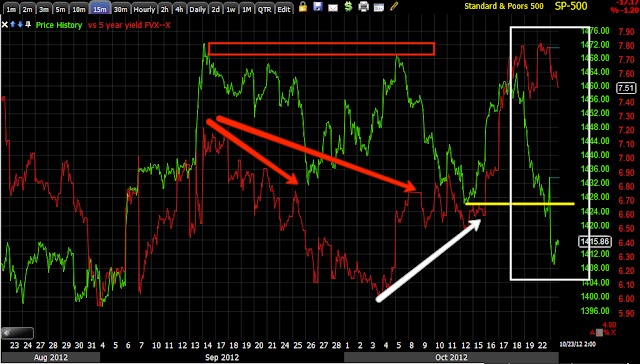
 Yields shows one reason we most likely saw an intraday negative divergence in the last market update as you can see they diverge with the SPX.

 Bigger picture on a 15 min chart though and we see the negatives at the last two top areas and a positive divergence going in to last week's top area and a continued leading positive divergence in Yields, these act like a magnet for the market so the bigger picture for the shakeout bounce/rally is still very much intact.

 The $AUD intraday is in line with the SPX.

 On a longer basis it went negative at the second top in this congestion area ann went positive before last week's top and remains in a positive divergence.

 The Euro is a better confirmation indicator and intraday it was not confirming around the time the negative 3C intraday divergences formed.

 Longer term the Euro was negative at the second top-not confirming, went positive at the lows before last week's top and remain in a positive area vs the SPX.

 High Yield Corp. Credit (HYG) is following the SPX intraday.

 Bigger picture it was negative at the second top of the 3, positive in to the lows before last week's top and still in a very positive divergence with the SPX.


 High Yield Junk Credit is showing the same signals.

Sector rotation...
Just as suspected last Friday and the reason I held off on entering any financials, Financials in green at the bottom are rotating out as we saw start yesterday and Tech in, however we are now close to the point in which we may see that rotation start to reverse with Financials basically near the trough of the wave form of rotation.

Also interesting, Discretionary is performing much better than market price action alone would suggest, so are Industrials. Basic Materials which is loaded with momentum stocks was hit pretty hard today as was Energy, Energy is another that may be so low in the rotational scheme of things that it is near the bottom and ready to start rotating back in.

Alo interesting, Staples, Healthcare and Utilities, the Defensive Sectors or Flight to Safety Trade did not see very significant rotation on today's market action, really barely budged from yesterday, that is interesting and you don't see it often. My guess would be Flight to safety sectors including Treasuries (I do need to check them) are seeing cash flow rotate out of them and in to more risk on sectors.