This has just been a nightmare of an asset to analyze and as a result, silver positions have historically been few and far between here. The recent SLV September $24 Puts worked out, that position was phased out of in two parts last week, the first making +30% and the second +54%, I don't mind trades in Silver IF there's a strong, objective evidence backing it up. When I chose options over straight equity longs like SLV or leveraged ETF longs, I'm basically saying, "I like the trade, but to make it worthwhile, it needs leverage" and that typically stems from the trade not being a very long term trade.
You see, as many option positions as I have put up over the last 6 months or so, you have to understand I REALLY don't like leverage and only use it when I think there's a great high probability trade/signal, but there isn't enough profit potential to make it worthwhile and with a market that is topping we get a lot of ranges and chop and it's difficult to enter positions for swing or trend trades in that environment so I have to resort to the best tool for the trade and that often means a short trade needs leverage to make it worthwhile. If I thought SLV was a swing trade of 2 weeks or so, I might go with a 2x leveraged ETF. If I thought it was a trend trade of over a month, I'd probably just go with SLV with no leverage.
So, that's some information you can glean from the type of position I chose, I really prefer not to use leverage, but when you are trying to take what the market is offering, you have to use the right tool for the trade.
Moving on to SLV and Silver futures, I did close the Puts last week in 2 parts, you'll see why and there are chart updates from Thursday's closure so you can check those out as well. Basically right now, Silver has multiple trends as is often the case with an asset, but there's not great confirmation of any single trend for longer trades, there will be, but not yet in my view.
This is going to be a little difficult to follow because there are multiple trends in place. The longer the chart, the more important the trend or larger the trend, but with multiple trends in place, the longer the chart, the further off the fulfillment of that trend and it may see numerous short to intermediate trends interrupt the longest or Primary trend.
Perhaps I should have started from longest to shortest, but for immediate usefulness, I thought working from short to long was better.

A 1 min chart's signal alone has about a 50/50 chance of a correction being either a sideways consolidation or a price correction (pullback), both are corrections, one is through time and the other through price to work off an overbought condition which is really to say "To let the weak hands fold".

The 2 min chart doesn't help much, if it were clearly negative, then a pullback in price would be high probability, much higher than a 1 min chart's 50/50. There is some 2 min weakness developing from the intraday in line, but in perspective non-confirmation. At this point, I'd give a slight edge to a price pullback, if the 2 min chart starts to give a stronger signal, then I'd increase the probabilities, the problem is that it needs to really show a stronger signal and maybe move to the 3 min chart because the 3 min below is strong.


If I had an SLV short here, I'd probably hold out, if the 1-3 min charts went negative clearly, I'd probably establish a short silver 2x leveraged ETF as I think there's a longer trend or long enough to not need options leverage.

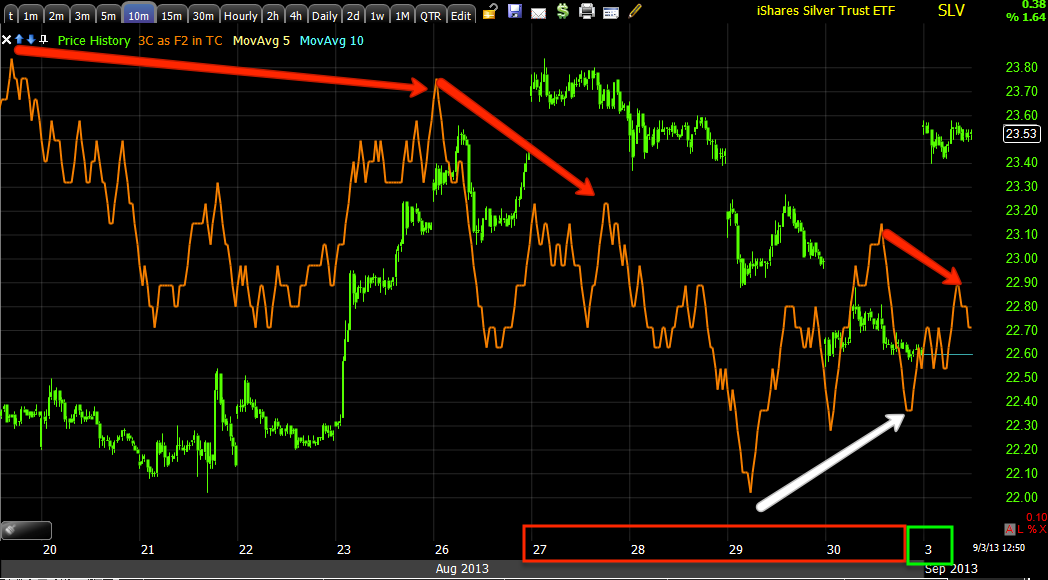
Now here's where a longer, perhaps intermediate trend, maybe even building to a primary trend starts to reveal itself.


To the left 3C is perfectly in line with the downtrend, the leading positive divergence is a MAJOR change of character, so I'm guessing Silver has a lot more upside over a longer time period.
THIS IS ONE OF THE BEST EXAMPLES OF MULTIPLE TIMEFRAME ANALYSIS THAT LETS YOU GET A ROUGH IDEA OF WHAT TRENDS YOU WANT TO TRADE AND WHAT KIND OF TRADES ARE BEST SUITED TO THEM. FOR A PULLBACK TO A BASE, I'D USE A 2-3X LEVERAGED SHORT, FOR THE PRIMARY UPTREND I'D USE NO LEVERAGE AND ONLY USE LEVERAGED TRADES ON SHORTER TERM CORRECTIONS WITHIN THE PRIMARY TREND.


No comments:
Post a Comment