Sure enough, if you saw our earlier post on the oil pump and dump, OPEC came out with an official denial so this was a TRUE pump and dump, but I'm not convinced it doesn't have something to do with our USO trade set up, we'll see.
As for Leading Indicators, they too are a bit tame today, but there's still some interesting things to see.
This is our SPX:RUT Ratio, usually in combination with the custom VIX term structure, but there's nothing to see on the latter. On this chart though, the red custom indicator is not confirming price action which is interesting given the chart of the Q's last week and the SPY with the Igloo/Chimney price pattern, the chimney is where the head fake is found and that's also where this indicator is not confirming price.
Here's the Igloo/Chimney price pattern in the SPY, note where 3C short term (timing) is not confirming, the exact same place although the two indicators have nothing whatsoever to do with each other.
This is an example of TLT's relationship or correlation with the SPX which is normally inverse or opposite so I inverted the SPX prices in green so you can see what it should look like, nearly exactly the same. You can also see the difference in the ROC of price from drifting down (which is really up for the SPX, but down for TLT in blue) to lateral or flat which is where we usually see the heaviest underlying 3C activity (bases and tops).
Last week we thought TLT / bonds (especially on the long end) would bounce.
This is a closer look of TLT vs SPX today, you can really see how much TLT has broken that which is the signal we look for as a leading indicator.
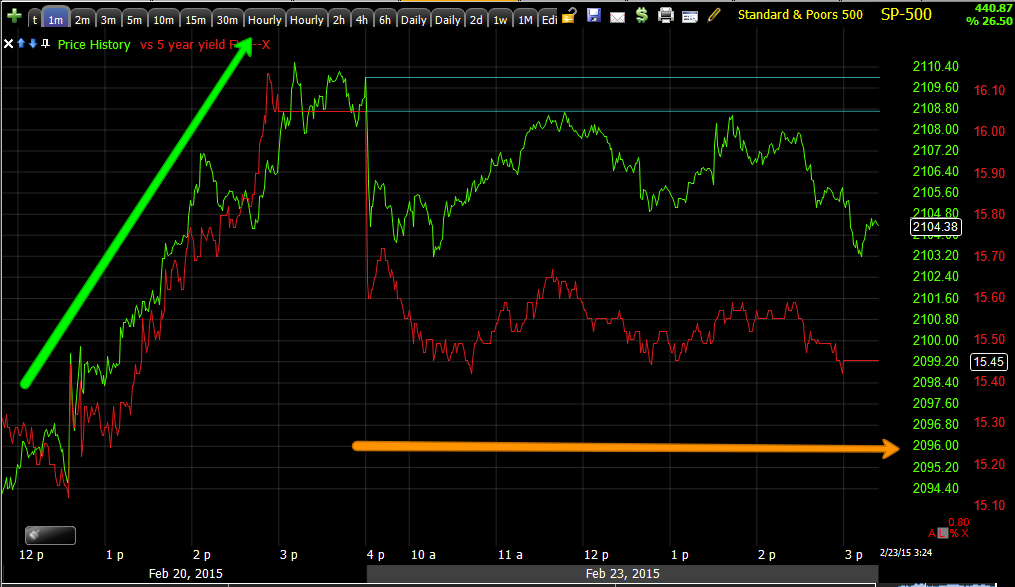
This would be the SPX (green) since the last base (the 3rd of the year from 1/29 to 2/2) and 30 year yields in red, remember that equities are drawn toward yields like a magnet.
This is significant because of the change we are expecting and seeing in TLT and bonds. Yields move opposite bond prices so TLT / bonds moving up as we saw above send yields down and you can see the tight correlation between yields and the SPX, so a move down in yields pressures the market lower
. Again, interestingly this is occurring at the point in which a Chimney (head fake and excellent price timing signal) is showing up on the averages and being confirmed as a head fake.
As a quick example, as I usually say "a head fake move is usually the last thing we see just before a reversal", here's one of the last and significant ones in which we were predicting the head fake (Chimney) days in advance, similar to this situation as well.
This was a well known rounding top with the "Chimney" head fake predicted days in advance, it turns out to be the last move just prior to a deep correction at minimum, a break in trend on a primary basis being even more likely as the market has formed a megaphone or Broadening Top in most averages since then.
*The last day of the chimney also corresponded with the F_E_D's Bullard making comments that the F_E_D "Should be willing to remove accommodation".
I only bring this up because of the article I wrote,
The Plunge Protection and Market Correction Team which is a different take that is not only encompassing the PPT aspect of the F_E_D, but in fact, maybe a "too cozy" relationship indeed as Bullard alone's comments corresponded with areas we had already marked out as being in distribution or accumulation, the market doesn't just make money by going up, it makes it just as fast if not faster moving down.
First Bullard makes a hawkish statement aligning with our Igloo/Chimney top, sending prices to the October lows where EVERYONE was a bear. We had identified accumulation and even said this move was going to be so strong, you wouldn't emotionally want to short in to it even though you knew it was coming and why in advance before it even started with the "dare" to book mark the post and come back to it after the move had completed.
At the October lows when we were expecting this "Monster" or "Face Ripping" move up, at the same time sentiment indicators made new bearish records, Bullard changes to a dove saying the F_E_D should delay ending QE3. Weeks later his assessment of the economy has changed and he's back to a hawk and after that, barely a month has passed, but he changes his stance on inflation.
You can't get any sort of read on inflationary trends in a month, it's statistical noise!
Again, I just mention it because of the indications, the price pattern and Yellen speaking the next 2 days. Who knows?
Here's a closer view (intraday) of 5 year yields, note the "in line" status Friday and the divergence today.
And as you know, while QE was underway, input costs soared which caused the F_E_D to take action on commodity prices and the once excellent leading indicator became near useless, but since QE3 has ended at October 31st, it seems Commodities (brown vs. SPX green) are once again acting as a leading indicator.
Above you can see 3C negative and positive divergence vs the SPX. The largest divergence of this year is negative and right now.
And as far as that "Chimney" goes, look at the larger than normal negative move in commodities right where we expect and got a chimney head fake move.
In addition, the Baltic DRY Index (the daily posted price to ship dry goods over sea) hit another new record low. This morning we found out that a 3rd shipping (Dry bulk carrier) will go belly up in as many weeks while China's COSCO decommissioned and scrapped 8 dry goods ships in January, an effort that cost them nearly double what they received for the scrap.
The price of commodities taken with the DRY Index which isn't traded and thus not manipulated, all point to the same thing, Global recession.
More on the way...


No comments:
Post a Comment