Today's gap down was on what I'd call a fundamental surprise event, the breakdown of Bloomberg quote terminals (these are widely used in institutional circles, apparently more for communication which makes sense given divergences tend to cluster) than the actual data/analysis. The number of comments from traders today reduced to having to use telephones to facilitate deals and their feelings about that shows just how much they talk to each other over the Bloomberg terminals and how reliant they are on them, as most described the lack of terminals, which didn't see full service restoration until around 11 a.m. this morning.
A fundamental event is a surprise to the market, one they weren't prepared for, otherwise I believe the SKEW Index would have been much higher as they hedged positions (SKEW is at a mediocre $119 far from the Black Swan hedging we have seen in the recent past). These events are discounted on the Fly, Black Friday was a fundamental event, the tragedy and market reaction of 9/11 was a fundamental event, etc. The market had no way to discount them and had to do so on the fly.
We do have a gap which I suspect holds large losses for middlemen/market makers/Specialists, HFT algo trading firms that have been filling that role, etc. so other than the fact that the market has been RELENTLESS about filling gaps the last 5-6 years, I suspect this one needs to be filled as well otherwise some large , unhedged losses will be taken by institutional money and they don't generally like that.
The DIA's short term charts as well as TICK seems to show their attempts to work on a gap fill, although the premiums from the max-pain pin which should have been somewhere around yesterday's close, are likely a total loss now.

I do find the Chinese events interesting given the FXI analysis since last Friday suggesting a top and something ugly coming.


As for the US market...

If today's SPX daily candle ends something like what I've drawn in above over the green arrow, a Hammer , we already have the increased volume; then I suspect a gap fill to recoup unforeseen /unhedged losses in a market that's near obsessive/compulsive about filling gaps (which is a shame as they are/were fantastic information) anyway. However, I think now more than ever, a certainly more than anytime this month, it's important to back away from the charts and take a wider perspective view of the market and of what we expected when we forecast the Triangle/volatility pinched-based move to the upside on April 2nd which has been right on with last Friday's Week Ahead forecasting a top in the market and a reversal process, which was elaborated on with numerous examples Tuesday (all links can be found in last night's Daily Wrap post).
The important thing to ask is, "Did the market do what we forecast? And did the indicators act as we suspected?"
The answer to both is YES as the forecast of April second, just like the VERY ACCURATE $USD Forecast of the same date has played out EXACTLY as we forecast.
Now consider the second half of the forecast, which assumed a rally BEFORE it even happened, assumed the indicators would fall apart and distribution would be heavy as it was and this before it even started. The second half of the forecast, just like the $USD's similar forecast of UP and then a larger move DOWN which has already started with the "UP" portion complete, again forecasted WELL before any price moves in the direction (the $USD was actually down on that day) as you can see in numerous posts the last several days has had a tight and leading correlation with the market in general.
IF our forecasts about everything else from 2 weeks ago have been this accurate, why should we assume the next step or second half of the forecast would be any less so?
Intraday DIA divergences...


\However as I said, it's time to step back from the day to day analysis and look at the bigger picture as we did on Thursday, April 2nd just before the April 3rd, Good Friday holiday.

Look at the 5 min chart's reaction and signals at the base area and since the move up, currently horribly leading negative. This is the larger perspective view beyond a short term gap fill bounce probability. This is the TREND.

Just look at the 3C chart for a moment, even beyond my annotations.


3- min SPY charts with two "W" bases and positive divergences and the negatives at the end of the trend they supported both earlier and right now.

The red on the time axis represent the year 2015, note the largely lateral price trend through the year, A HUGE CHANGE IN CHARACTER VS THE 2013/2014 PRICE TREND.
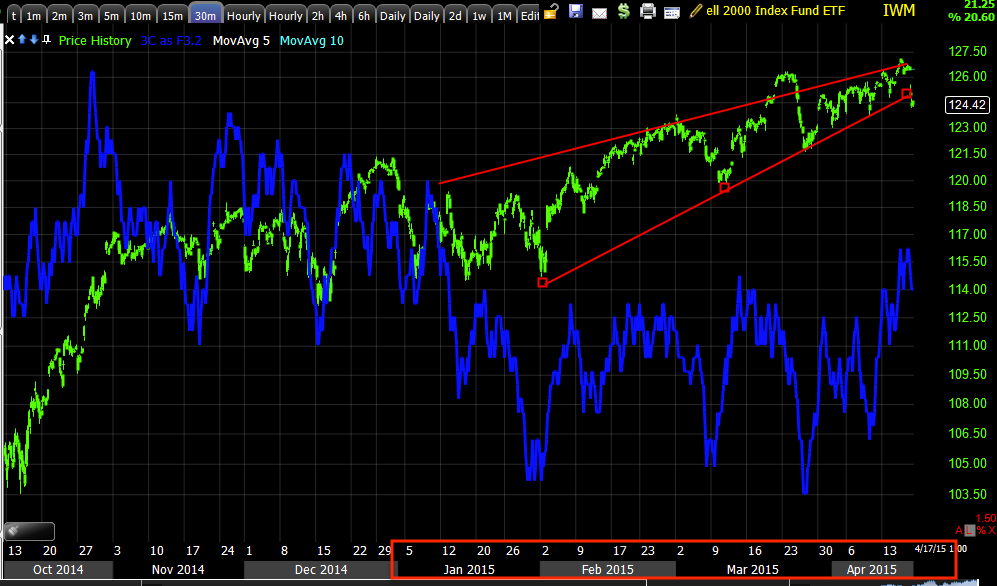

The point being, although I have said "We are close", look at these larger trend based perspectives, I think you can see how close we are, not only how close, but in any prior circumstances, we'd already have broken to the downside as this is one of the worst divergences on the charts as we had expected based on larger negatives already in place.
I'll add additional analysis, but I don't think we need it for the trend perspective, just for pivot/timing or near term perspective. Price and the charts did exactly what we forecast 2 weeks ago. EXACTLY


No comments:
Post a Comment