When dealing with a trend, we are always on the lookout for changes in the character of the trend, I pointed out a few Friday.
Here's the SPY and Bollinger bands (10 min), notice the period of diminished volatility (band squeeze) is now longer then at any point since the trend started on the 27th.
The 50-bar 10 min average which has held as support, as I pointed out n the last post, has been broken, it's also starting to turn flat. RSI is negative here toward the top of the trend.
Whenever a major support level breaks, rarely is it a clean break. We should always expect volatility, even a new high. New false/head fake highs are often the key to a reversal. Note the volume around the break of the m.a.
Looking at the inverse UltraPro Short S&P-500, we have a 10 min positive divergence similar to the 10-min negative divergence in the SPY.
UPRO, the Ultralong S&P-500 has a 10 min negative dvergene
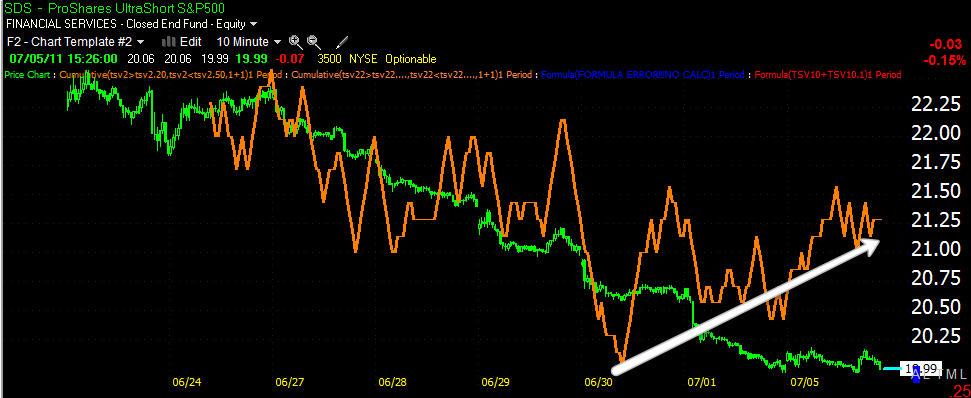
SDS the Ultrashort ETF for the S&P-500 has a 10-min positive divergence (the point in looking at these ETFs which are leveraged long and inverse or leveraged short is to show correlation).
The TCK Index has been the most negative today since the trend started on 6/27 and we now have a sub -1300 reading (readings below -1000 are rare).
I pointed out late last week how the Australian dollar has some predictive value in which direction the market will be heading as a leading indicator. Note that on Thursday while the market put n a strong performance, the FXA put in an indecision candle, followed by a strong candle which could not break to a new high (the market did break to a new high that day) and today there's significant relative weakness in the FXA vs. the market.
This is the FXE Euro Trust ETF vs the SPY in red, note the correlation between the two as a strong Euro means a weak dollar which is typically good for equities. The last few days the Euro has diverged noticeably from the SPY.
And the 10-min FXE Euro ETF's 3C hart is in a deep 10-min negative divergence. Price is always the final judge, but we need to look at the evidence in front of us and start thinking about our long side risk, entries n short positions, etc. This doesn't mean today will definitely be a reversal day, but it does show us a trend that has been consistent in which we are now seeing significant inconsistencies.


 | Theme by Thur
No comments:
Post a Comment