ERY is a 3x leveraged inverse ETF for Energy, or a 3x Bear Energy ETF.
This is the 30 min 3C chart of ERY or "the big picture". You can see accumulation in July, confirmation of the rally in August (green arrow) and distribution on a parabolic spike in August (red arrow), then confirmation of the downtrend (green arrow). There's no positive divergence on this chart, so the move up in ERY, which I believe is coming, is not going to be as big of a move as the two previous moves up and down.
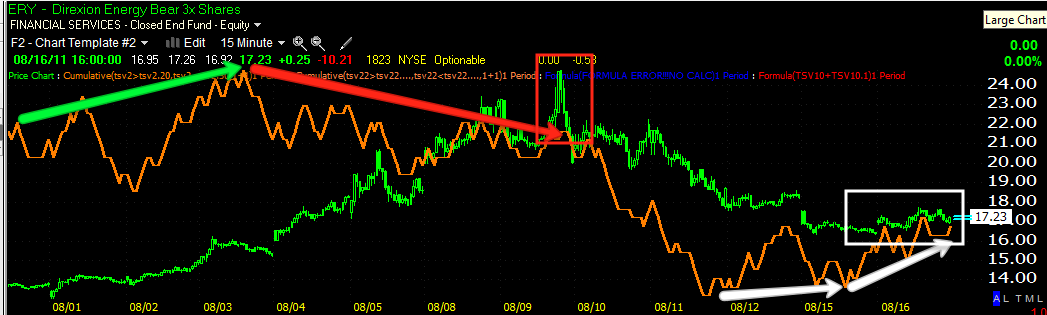
The 15 min chart shows some hints of accumulation recently, it also gives a clearer picture of when distribution started and how the parabolic spike was and generally are, great indications of a turning point, they play the same role as a false breakout for the same reasons.
The 10 min 3C chart gives us a clear picture of when accumulation started in ERY, it has been largely over the last two days, which is good for a pretty decent move, maybe 2-3 days or so up, perhaps another day or two for a reversal down, it all depends on how quickly the shares that were accumulated are distributed.
The 5 min chart shows us when price was being confirmed by 3C in the green box and when 3C went positive and started to lead price in the white box; again roughly 2-days.
The one minute chart isn't screaming it' ready to pop, there could be a longer period of accumulation, but there are a few signs if you compare the relative placement of price and 3C at the peak and trough, both the peak and trough showed bullish 3C action.
I think ERY has a few solid days of gains in it, of course that fits with my stance in the short term on USO.


 | Theme by Thur
No comments:
Post a Comment