XME is a metals/miners ETf that tries to mimic the S&P Metals & Mining Select Industry Index so it is more diversified than GDX for example.
In any case, despite the lower than I prefer volume, there seems to be something going on there, which may be worth investigating some other US miner stocks in particular. As I mentioned to the member, when I look for a trade, the first thing I look at is the market as it has the most gravitational or directional pull on any given stock, the actual stock is usually the last thing I look at. The earlier market update I was preparing before the IWM 5 min chart jumped before my eyes, was showing the funk the market has been in this week since the EU announced the Spanish Banking Bailout which backfired in their faces in typical EU problem solving fashion and sent Spanish sovereign debt to record high yileds.
I'm getting a bit off track, but as mentioned Sunday night, "Watch the Spanish Yields". The EU is going to have to come up with some rumors, lies or something concrete to undo the damage they did to Spain this week. The reason I mention this is because we want high probability trades with low risk, the market so far this week has not given us that environment. Your portfolio capital is precious, I demand a high probability environment before risking money.
Back to the Metals and Miners, XME...
Price alone seems to be indicating the character of XME is changing.
The Trend Channel has a Buy to cover short stop at $41.30, a move above that level would also show a change in character in the stock. The Trend Channel is meant to sniff out changes in character of the 2 week behavior of a stock, typically when there's a change in that, there's a change in trend nearby.
As for 3C...
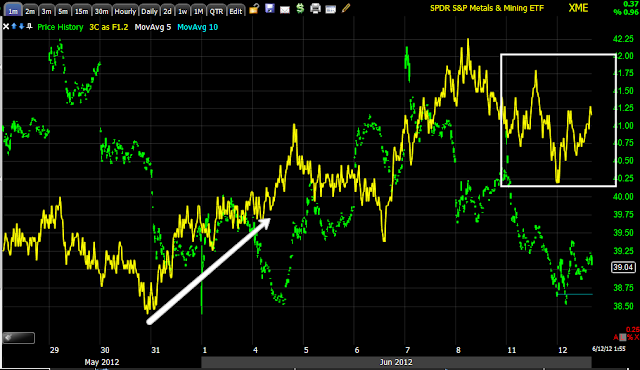
The 1 min chart on its own doesn't seem to show much except the disaster open on Monday being sold in to. There's a small positive divergence today, but that wouldn't be enough to interest me.
Step back and look at the 1 min trend and a different picture emerges, the current position is leading positive.
The 5 min chart reduces some of the intraday noise and shows a clean divergence, also in leading positive position.
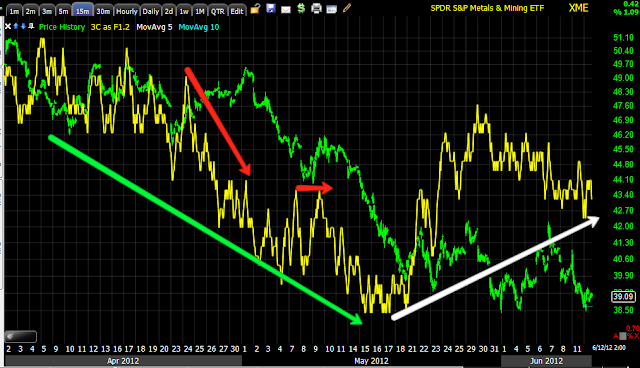
The change in character on the 15 min chart is pretty clear, from a confirmed downtrend with a few negative divergences on bounces to a reversal to a leading positive divergence.
The 30 min chart shows a pretty decent size positive divergence building here too from about May 18th or so.
Finally the 60 min chart shows the top and negative divergence, trend confirmation on the way down and a big change to a leading positive divergence, also around the same period.
In my view it's a matter of tactical entry or looking at stocks within the sector. I doubt XME is a closely watched ETF, so I wouldn't say the typical head fake move that starts a reversal is high probability, but it would be a good timing signal if it occurred, the move would need to break below the $38.30 level. Further confirmation could be a break above the trend channel.
In any case, something definitely seems to be going on in XME and these are the strong signals I prefer. I also think some US metals/miners are worth a look.
Is interest rates about to start going up?
-
Yes, I know - it does not make any sense - FED is about to cut
rates...but....real world interest rates are not always what FED wants it
to be.
6 years ago


No comments:
Post a Comment