Again for the second day GLD is moving or was moving this morning, against it's FX correlation and up with the $USD. GLD is trapped between some longer term charts that still look bullish from that positive divergence at the May 30th lows that sent GLD soaring and between deteriorating mid term (5-15 min) charts. The short term charts have been pretty strong, thus the short term charts "if" they can keep up the strength, should effect mid term charts and all timeframes would be bullish, that is "if" the short term charts can keep it up and we are starting to see an intraday negative divergence on the short term charts. However the bigger question with gold acting as an easing expectations indicator and the F_O_M_C coming up in 9 days, what if anything is this telling us about the F_O_M_C?
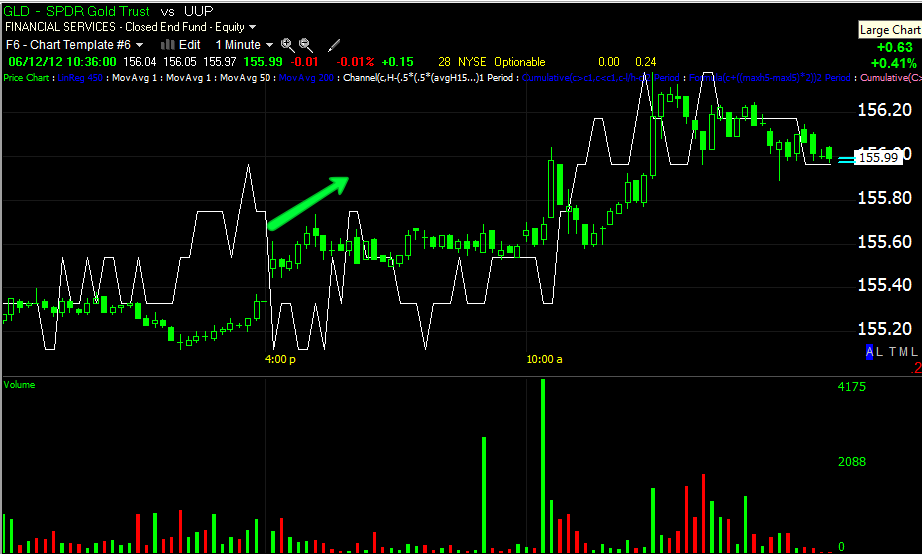
Again GLD in green is trading up this a.m. with the dollar (there's usually an inverse correlation), so this is strange.
The 1 min trend has largely been in confirmation of the recent move with a negative divergence jut forming this a.m., but as you see it wouldn't be the first and the trend remained uninterrupted.
Intraday 2 min is also seeing bit of a negative divergence, I'd say it's too early in the day to make much of these divergences, but I think we need to pay attention to gold and what if any message it is sending, perhaps about the upcoming F_O_M_C meeting.


 | Theme by Thur
No comments:
Post a Comment