The long term Trend Channel in GLD has been broken, thus the uptrend that was in place is broken, any new uptrends will have to start with a new channel. Volatility has also increased, a tell-tale sign of a top, look at channel width in 2009 vs now.
The long term 5 day MoneyStream chart of GLD is very negative
As is the daily, this is a totally different indicator than 3C.
The longer term 4 hour chart of 3C is leading negative as well, the long term prospects for gold or at least GLD don't look good.
The hourly trend is leading negative, but...
A close up view shows a positive divergence developing within that trend, the trend takes precedence over the longer term and probabilities, but there's no reason this relative positive divergence can't send GLD higher within this topping area it is in.
The 30 min trend is like the 60 min, leading negative, but again, within the price area in the red box, this doesn't mean GLD will simply fall straight down in a straight line, a closer look at the 30 min chart...
Also shows a relative and a slightly leading positive divergence. These are much shorter term indications, but they are just as real.
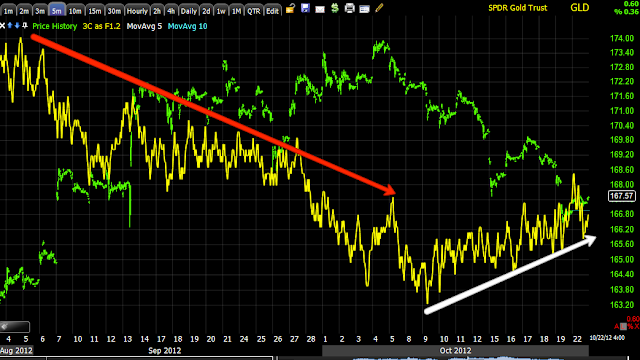
The 15 min chart after having gone negative and GLD having fell is now in a leading positive divergence, for these reasons, I think GLD has a perfectly reasonable probability of moving higher within the congestion/top area it is in.
The 10 min chart has the same signals as the 15, first negative sending GLD lower and then a leading positive indicating GLD is likely to make a move higher, but not a new primary up trend, the long term trends of these timeframes all argue against such a scenario.


No comments:
Post a Comment