Whistling Past the Graveyard
What I'm going to discuss tonight is
not so much technical in nature as it is psychological. When I first
really dove in to the market during the mid to late 1990's, there
were really 3 major forms of analysis, Fundamental which was the
primary and just starting give way to the second, Technical and the
third which never garnered too much attention, Mass Psychology. I
dove in to all of them, but mass psychology didn't have the same
tools available in real time as it does now and as I said, never
really caught on like the other two.
Something recently has been causing me
more concern than I usually have (when I say, “concern” it's not
concern for myself, my analysis or my members, I mean for the market
in a general way). This week and last, I spoke quite a bit about the
Dow 14,000 hype, the way it is portrayed on CNBC in commercials like
an action movie trailer, the psychological allure and something I
didn't really think we'd see any time soon- retail investors coming
back in to the market after more than a year of nearly weekly
consecutive outflows. It seems things have changed and at the most
basic market behavioral level, there are two simple concepts:
- Wall Street and Main Street can't be on the same side of the boat too long in a zero-sum game
- You know this one... “What does Wall Street or someone like Dan Loeb who is selling 11 million shares of Yahoo in two days with an incredible 2 cent dspread on the fill NEED to get that done?” The answer of course is demand and it's behind numerous concepts that have served us well in positioning, knowing when and where to position with the highest probabilities and least risk and a whole host of other concepts all tie in to the simple fact that with the size Wall St. sells, they need demand, with the size in which they buy, they need supply and you can figure out what the actual market looks like when demand from dumb money is high and when supply from dumb money is high.
A few weeks ago a site called The Right Side of the Chart put out a great piece of analysis and went
through the painstaking task of taking all the historic AAII data,
looking for 18+ bullish/bearish spreads and placed them on a price
chart that looked like this...

Last week I told you the AAI Investor
sentiment survey, which has had a solid record of bullish and bearish
reversals when the survey has an 18 point spread between the Bulls
and the Bears (if the bearish sentiment is 18 points higher than the
bullish, there has historically been a bottom, when the bullish
sentiment is 18 or more points above the bearish sentiment,
historically it has been a top). Last week the AAII survey's bullish
over bearish sentiment survey had risen to a very high 28 point
spread in the bulls favor.
This week the AAII looks like this...
|
Survey
results:
Bullish: 48.0%, down 4.3 points
Neutral:
27.7%, up 4.3 points
Bearish: 24.3%, unchanged
Long-term
averages:
Bullish:
39.0%
Neutral: 30.5%
Bearish: 30.5% |
The bearish sentiment remains the same
and below the long term average, the bullish sentiment lost 4.3
points and the Neutral gained 4.3 points to leave the survey with a
24 point bullish spread, still well above the historic 18 point
spread that has been at market turning points; this is nearly 3 weeks
of 18+ point spreads whereas before the spreads were much more
moderate.
The sentiment data is interesting, it's
helpful, but it's not an exact pin point as extremes in sentiment can
last a fair amount of time as was pointed out on the chart above
(*Dual buy or sell signals in close proximity often result in major
market turns), which is something I find interesting when looking not
only at the usual data of 3C charts, the ever widening spread between
credit and stocks, but also on my custom DeMark inspired indicator.
I've found large sell or buy signals tend to correlate to the size of
the reversal. You may recall that the buy signal in the VIX on 1/23
through 1/25 was a beautiful buy on the VIX, however more interesting
is the large sell signal in many of the market averages.

The former buy and sell signals on the VIX were accurate with the custom indicator, I warned that the huge Bollinger band volatility (see long red vertical trend lines) which is squeezing, is priming the VIX for a highly directional move. Just based on common sense, there's not a lot of room on the downside for such a large directional move, plus we have the buy signal, but as I was saying and pointed out Friday, the VIX is in a perfect place for a little volatility head fake itself and that' what we saw Friday with a move below the 20 bar average, the market just is predictable in many ways like this.

While the Dow and S&P are better known, those in the know, know the Russell 2000 is one of the most important averages to follow as far as the health of a trend, its performance can tell you a lot about the market that may not be otherwise apparent. Ae have a HUGE sell signal on the same indicator in the R2K, past signals have worked beautifully, I've seen these large signals and they tend to be huge moves. Not only that, but the entire signal takes up just about all of trend #1, as do many of the 3C leading negative divergences, it's very much like Trend #1 is acting as predicted before it even started, as a primer to dovetail in to trend #2, which I'm starting to wonder if this is going to be even bigger than the larger trend we expected.
What may be
scarier for those who experienced it during the later half of Q1 2012
as we were setting up 9 core short positions, all of which were
sporting double digit returns using no leverage by early June, was
the economic data that was coming out with head line beats after
being heavily massaged with arbitrary seasonal adjustments, as soon
as the seasonal adjustment period ended, the market took a dive to
the early June 2012 lows. For ANYONE who was paying attention to the
details and not just the headline economic data, it was clear there
was major trouble and the headline was a cheap, thin facade masking
an economy that was considerably more rotten than the sheeple were
being led to believe.
Again we have a
similar situation at the same time of year that has even had a few of
our members thinking the U.S. economy was improving, of course it's
hard to blame them as they are being bombarded with propaganda day
and night on the Financial networks that are selling that bill of
goods. However if the 4 consecutive regional F_E_D economic activity
prints weren't enough to convince you that this propaganda was
another thin veneer of subterfuge, then the Q4 GDP that recently came
out with a consensus of 1.0 missed even that, which had been lowered
from the previous 3.1 because of “Super Storm Sandy”, GDP printed
at -.1 to give the U.S the FIRST NEGATIVE GDP PRINT SICE 2009!
The definition of
recession is two consecutive quarters of negative GDP prints and it's hard to see how a recession is staved off with government spending
about to drop (which accounts for a large part of GDP) and taxes set
to go up for 80% of Americans. If there is a saving grace it will
likely be that Q4 GDP is revised 0.2% higher so there's no 2
consecutive quarters, but that's just more massaging of data, the
point to focus on is the “Improving Economy” being sold can't be
improving if we are printing negative GDP and a huge drop at that
from +3.1 to -.01 with consensus of +1.0!
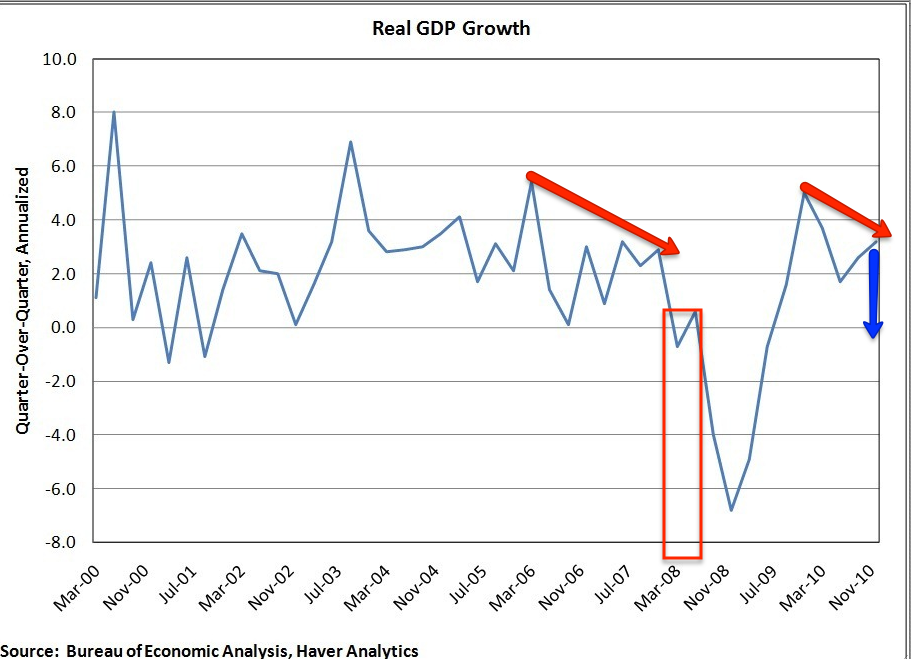
GDP just saw the first negative print in 4 years and a lot of downside momentum as it is near the blue arrow I drew in, notice anything similar about the pattern now vs the pattern around the 2007 top?
With all the
government had done and kept doing (which will be scaled back very
shortly) and the extraordinary F_E_D accommodative policy, this print
has to be heart breaking for the kick the can policy makers, after al
that stimulus we get the first negative print in 4 years.
If that wasn't bad
enough, Germany just printed negative GDP as contagion in the EU
finally hit the only and real core, over the next couple of months
the market not only has to worry about the periphery of the EU
slipping in to a deeper decline (the PIIGS), but the core itself is 1
print away from recession and this as the latest LTRO 2 loan
repayment came in at about 1% of what was expected further giving
real reason for investors to worry that there really is something
still very wrong in the European banking system.
Sometimes you find
economic indictions in the most surprising places, but if the German
manufacturing powerhouse is truly slipping (as indications are
showing right down to port usage), this chart, as odd as it is, tells
us something...

This is multi-year so it's not seasonal, this looks a lot more like massive power consumption demand falling, like that of a manufacturing sector, we already know they also have a negative GDP print to everyone's horror.
Then add to that
the fears of the US slipping in to recession and the chances of
another round of downgrades as Congress makes another mess of the
debt ceiling, remember it wasn't so much the US economy as it was
Congressional inability to work together last time this topic came
up. Now instead of the market rotating between fears over the EU and
the US (both of which have been on the back-burner for the last
several months other than some political situations), the market may
have to worry about both at the same time with North American and
European recession, who knows what happens in China- yet dumb money
flocks back in to the market, whistling past the graveyard which
reminds me of a quote I saw today, “"The
wise man does at once what the fool does finally."
While
European Confidence Surveys like the German Zew poll show similar
attitudes in Europe as here in the U.S., consider the peripheral
markets there recently.
The
Spanish IBEX saw its biggest weekly drop of -6% in 6 months.

Italy's
FTSE MIB Index saw a drop of -3.36% Thursday, another “largest 6
month decline” except in a day.
Even
the FTSE saw some remarkable volatility that I haven't seen on this
chart, hitting a 40/40 Bollinger Band as we work toward the core.
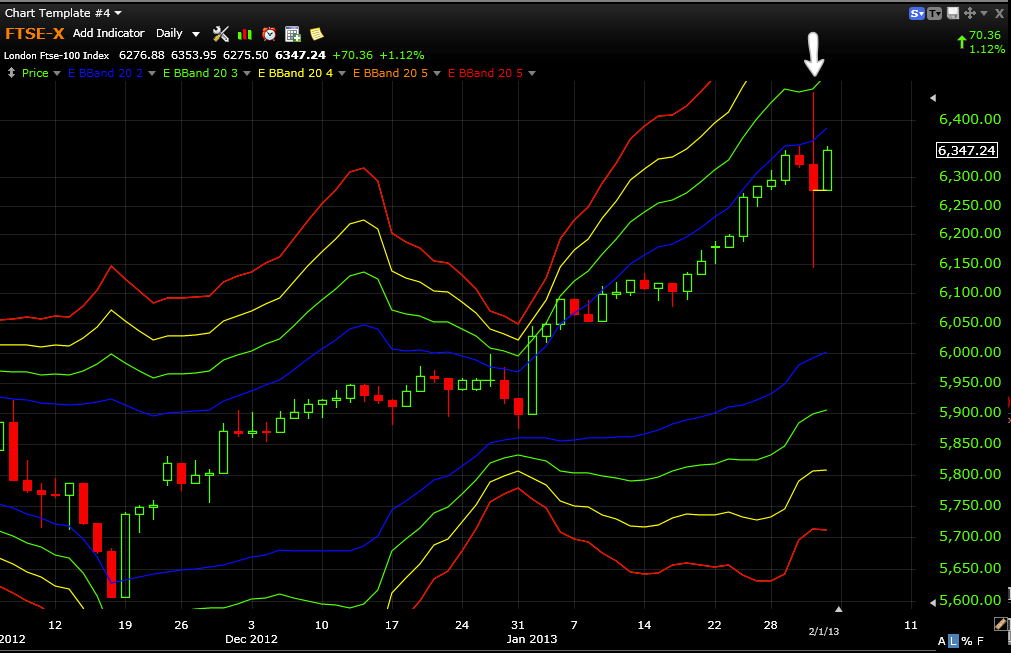
That's a daily chart with huge 1 day volatility hitting a wider Bollinger Band that is hit maybe once or twice a year.
I
suppose the point I'm getting at, whether I post 1 sentiment
indicator or 10, is that the market behavior that first set up
followed by the accumulation to confirm what was predicted as a
strong move up, trend #1 which judging from the charts is set to
dovetail in to trend #2 (larger, longer and down) coincides with what
is becoming more than what I originally thought, it is taking on the
shape of a more definitive, larger, more important top and all of the
recent subterfuge about the economy getting better, the very low
volatility (investor friendly environment) with no pullbacks (making
any one feel like they are an absolute genius) is all too neat and
organized to lure retail back in to the market which brings us back
to the very simple concept of, “What do institutional trades,
moving tens of millions, hundreds of millions of shares-whether
selling them or building a short position need?” They need demand,
they need higher prices, they need someone dumb enough to hold the
bag as it is handed off to them.
I
mentioned rising volatility last week as it always accompanies
turning points, whether up or down and planned on spending a bit of
time in this post illustrating the rising volatility (a less investor
or dumb money friendly environment, but once you have them in the
door emotion and hope will keep them inside for longer than you might
think). I'll post this one chart showing trend #1 and the rising
volatility and you can keep in mind some of the PIIGS markets while
looking at this.

This is showing the volatility during all of Trend #1 moving from 0 to .28 as the high to low range, the last couple of days alone it went from 0 to +.59, more than double the month long range in a day. Why is this important? Not only is volatility a common occurrence before a trend change, but any significant change in character often leads to a change in tend, that's how the whole UNG trade started with us interested in buying it while it was still moving down, it had shown nothing in price, but in other places there were many significant changes in character.
If CNBC was really interested in helping their viewers make money, then they'd explain a chart that is far more important than earnings, P/E's, moving averages or any of that, but I suspect most people's eyes would glaze over...This is one of the scariest charts out there because this is a huge, leveraged market where big money and very smart money plays, if they felt ok about making money in this market, this chart wouldn't look like this...

High Yield Corporate Credit which is a huge, liquid market and credit is traded on massive margin so if the High Yield weren't enough, the size and leverage of the market makes it a playground and choice risk on asset for the smartest of smart money, thus the saying, "Credit leads, equities follow".
The plunge here has taken out the entire trend 1 range other than the first gap up day and did it in 1 week. This is a worrisome chart for the market, but you'd never her about it on CNBC, but I guarantee all the guys on Fast Money and Cramer are watching these charts like hawks.
As for early opening FX and Futures trade...


As does the 5 min chart.
We'll see how the tone of the market looks early this week, if there's significant increases in volatility, then we have some great opportunities for 1 day (give or take) trades like the last QQQ trade except with more potential gains. If things start slipping fast, like the EUR/USD, then it's back up the truck and fill it up.
Here's to a great week, it looks like they just paid the electric bill at the Super-Dome.


No comments:
Post a Comment