This is the kind of trade that you can make some extra money while you wait for a bigger set up, but just because you know the probabilities are on your side and maybe you're a little bored from a range bound week, I think it's very important to still pick and choose your battles.
I can't stress this enough, knowing the probabilities is great, it's a lot more than most people know as we haven;t changed our tune all week while retail sentiment has shifted all week and retail sentiment from Investor.com has gone from 69% bearish yesterday and shot up to 81% bearish last night and now 64% bearish earlier this afternoon, they're literally flying by the seat of their pant, whatever the market is doing at that moment is what influences their opinion.
We don't have any such mechanism, everything is based on objective data and a lot of it, then any trades are based not just on the probabilities, but the best entry, the lowest risk, the best timing (we don't always succeed, but the TLT Puts yesterday as it was headed higher for the 6th of the last 7 days and a gain on the upside of a gain of +4.3% in the very low beta of TLT vs the SPX for the same period which was down 5 of the last 7 days with a loss of -2.1%.
Did we just get lucky to pick the right asset at its highs on the day just before it turned the next day and use options which were at a deep discount because of the intraday action and TLT near it's highest highs of this leg giving us a low risk, high probability, well suited entry for puts? No, it wasn't an accident, it also wasn't JUST the probabilities, but as you know options' premium are at their cheapest when things look the worst for the position you are going after (for instance our puts as TLT was making new highs for the last 7 days. All of this together gives us a lower risk profile, a higher profit potential and excellent timing as we don't want to waste anything on Theta/time decay. Today we have a nice double digit gain in the position.
The point really is that you can't be hard on yourself and say, "I should have done..." I know the probabilities, for most people that would be enough for them to load up the truck, but it's more than that, it's the set up as well. I'd rather miss the trade and I'm ok missing the trade, then take a sub-par position that has the potential to cost us and the worst part of that is having known ahead of time that this was not the best asset or the best time to enter the asset, you have to take full responsibility for taking what I'd call a, "Sub-par position".
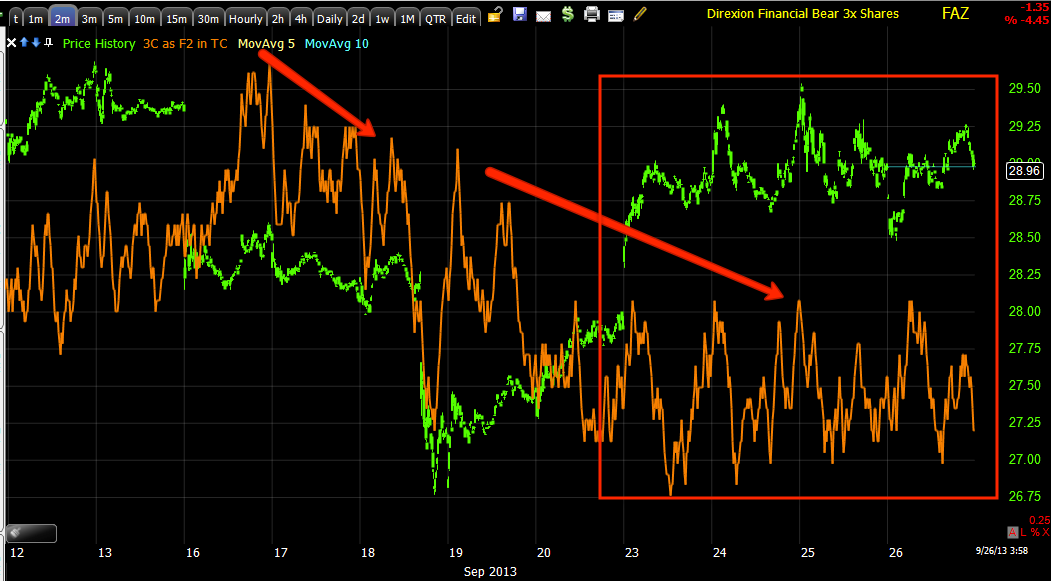
So here's Financials via the Industry group, XLF and the 3x leveraged long, FAS. I chose to use the broad industry groups as they are needed to help move the market being the second most influential factor on any given stock on any given day, this way I also avoid the news specific discounts that may make a specific Financial stock underperform the broad Industry group.
I'll also show you where, when and why I'd enter XLF long as a new position or an add to as well as FAS which have slightly different criteria for a long based on the options vs. the leveraged ETF and their individual dynamics.

You should be able to notice the steady trend of 3C distribution across the highs from July to the recent highs. There's no doubt that XLF is a short, strategically we have its number, now it's the tactical execution of the position and for that, we need to be patient and get that move above the yellow trendline and look for the signals that tell us, "This is high probability".

To me you have a clear bear flag, but what do we know about Technical Price patterns? More often than not they are traps, so while technical traders are looking for a break below the flag and an initial move down to about $19, I'm looking for a false breakout above the flag and a move back down below it.
However I told you the area I'd consider adding or starting a new XLF long position and that would be under the flag below the $20.00 level or specifically $20.03. This would be our Crazy Ivan shakeout and it would be useful in assisting with an upside move, but at this point, that's the only area I'd add unless I was using the ETF, FAS, then those few cents are of less importance.


No comments:
Post a Comment