Apparently this chart was first identified by Tom DeMark ad then McClellan picked up on it and now it's everywhere.
I'd much prefer to have seen DeMark or McClellan apply their indicators to do a comparative analysis between 1929 and today.
First, before I post the chart, MAKE NO MISTAKE, SINCE 2007 I HAVE MAINTAINED THAT I THINK WE WILL SEE THE UNITED STATES FIRST SECULAR BEAR MARKET IN EQUITIES. In 2007 I did a 5-part video, now 2 of the 5 parts are lost, the other three are on YouTube, but I compared bubbles since the first I'm aware of, the Netherlands' Tulip Craze from 1636 to 1637; The 1720 South Seas Company that bankrupted Sir Isaac Newton; the 1929 Stock Market Crash, the Dot.com bubble and we were just getting in to the Real Estate/Credit bubble.
I'm about as bearish as they come as far as the market moving forward not just because of what we see now, but what we can't anticipate like the effects of globalism, the SEC's incompetence, the rise of HFT and the demise of true buyers/sellers of last resort (market makers and specialists) as well as an over-zealous F_E_D and a world wide economic disaster in effect or looming, then the additional oddities that no one sees coming just as Janet Yellen didn't see the 2007 Credit bubble coming.
IT HAS BEEN MY OPINION THAT FOR THOSE WHO FIGURE OUT HOW TO NAVIGATE THIS NEW MARKET FIRST, THERE'S AN OPPORTUNITY OF A LIFETIME, PERHAPS MUCH LARGER. So I'm not poo-pooing the bearish sentiment this chart reflects.

We are basically looking at a time period about this big...
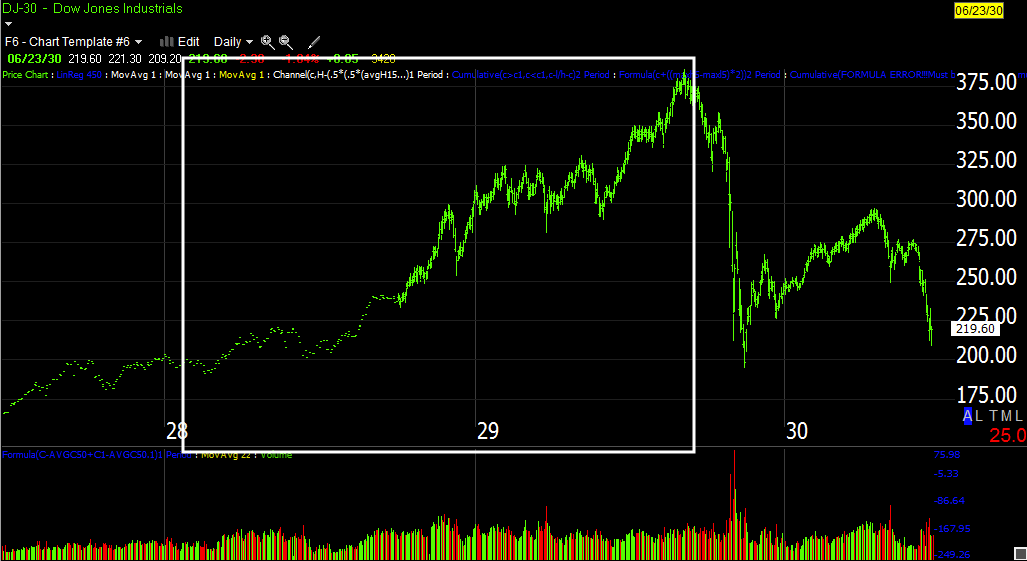
However, I think it's gaining traction because of the fear of the unknown and this looks like a road map to relieve some of that fear, but in that it can be dangerous, not that I don't expect a horrible decline, in fact I think the top is likely in, but it's what comes next and to assume one has anything to do with the other in my view stretches the bounds of reason.
What I do find more convincing is how the F_E_D stepped in during an economic recession in the early 1920's with Quantitative Easing and creating a recovery that blossomed in to the "Roaring 20's", a time of opulence and excess. It also is important to me that some of the largest bubbles we have had including the 1997 Asian Financial Crisis, the 1999-2000 Dot.com bubble and the 2007 Credit/Housing bubble all had the same hallmark, the F_E_D kept policy rates below the nominal growth rate of the economy for far too long.
We all know about the historic record highs in investor margin, you may not have known , but a new thing in the 1920's was margin allowing investors to put down 10-20% and borrow the rest from brokers. When we entered the Great Recession banks only had about $.10 on the dollar to cover investor deposits, much like our "Fractional Reserve banking" today. And perhaps most alarmingly was the F_E_D's Benjamin Strong who was actively engaged in QE during the late 1920's despite the fact the market and the economy had already recovered. Strong died in 1928 so he didn't see the monster he created, but famously bragged in 1927 that his QE which was the purchase of treasury bonds like now with the intent of driving down interest rates and expanding the money supply (like now) would give, "A little coup de Whiskey to the stock market".
Some of the effects of the 1929 crash which initially lasted 4-days with a loss of -25% and stretched from September 1929 to July8, 1932 included an unemployment rate of 25%, wages fell by -42%, economic growth fell by -50%.
Ultimately it took 25 years for the market to recover the September 1929 highs which included World War II.
In any case, I take this very seriously, but for me right now rather than overlay price patterns that can't compensate for all of the differences between now and then, I take the only objective data I have which is a comparison between 1929 and now on a daily 3C chart and what I see worries me for those who are not a part of the market that can learn to benefit from what's ahead.

Looking at the same daily 3C chart of the Dow now, I can only imagine how much worse this time will be, but in that is immense opportunity.


No comments:
Post a Comment