I have been hoping for a while to get some downside movement in FXP (China 25 Ultrashort) for a long entry as a way to play Chinese weakness broadly, it hasn't happened, but with today's move to the upside in China we are getting a possible entry long FXP, we definitely aren't there yet, but this is one to have on the radar and offers the kind of portfolio diversification that we just can't get in most US stocks broadly, plus it's a different global economy more so than ever.
So here's where we stand, what's likely to happen and how we can let FXP come to us at not only a better price, but lower risk and that's the difference between a high probability and a high probability/low risk trade.
This is the Daily FXP chart with Wilder's RSI 6, the divergence in RSI is clear and this is a nice opportunity that we haven't seen all year, I'd think FXP would be below the ascending trendline by the time it's looking like a possible/probable long play and thus we have some broad exposure to China.
My Custom DeMark inspired Buy/Sell signal indicator gave a clean buy at the bottom and several sell signals that worked well and a recent sell. At the orange box we have a Harami (bearish) candlestick reversal pattern, at the yellow box we have a head fake move or bull trap to new intraday highs which closed lower trapping longs buying the intraday breakout, that is enough to give us some decent downside momentum as most head fake moves are designed to provide (increased momentum).
*Note the gap, there's a decent probability it is filled before the ascending trendline is broken, although it's not as high a probability as other gaps in general just because we should eventually fill it any way.
As far as longer term 3C charts from 60 mins we can see the accumulation of the base and a head fake move as we almost always see right before a reversal (upside here) which was in the form of a run on stops, allowing a last accumulation effort as the stops provided supply at cheaper prices as well as creating a small bear trap for upside momentum on a short squeeze.
The distribution is clear as well, there was a head fake on the upside as an intraday break out just before the downside reversal,
head fake moves are an excellent timing cue for a reversal as they typically occur just before a reversal and we knew it was a head fake because there was a deeper leading negative divegrence in 3C at the attempted or failed breakout.
Just for confirmation, the 30 min chart.
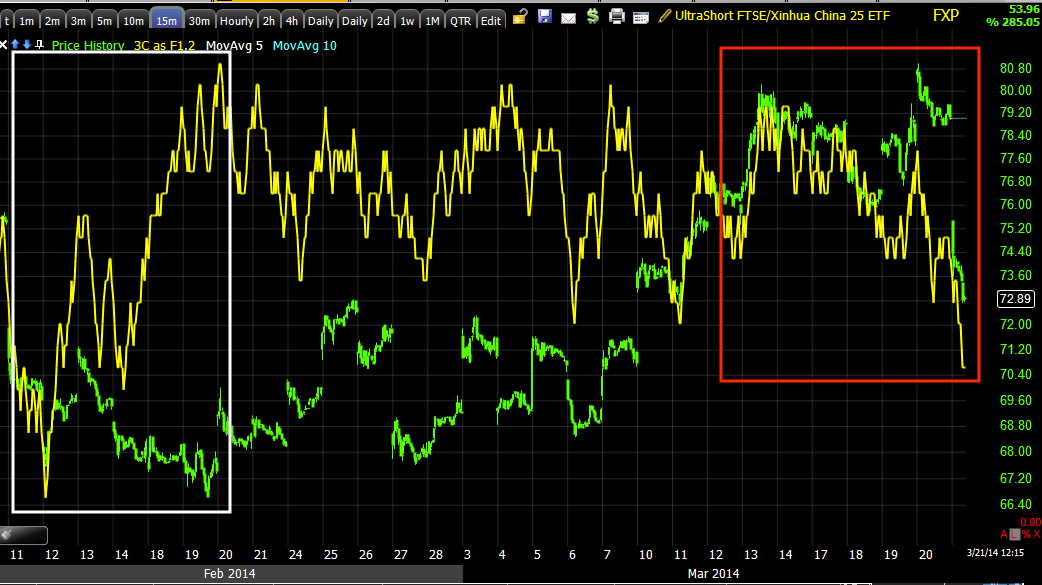
Again for confirmation the 15 min chart so we aren't dealing with an anomaly.
The 10 min chart has much more detail from confirmation of the uptrend to distribution, but for a pullback,
China is not fixed, in fact it's on the slippery slope.
As far as the intraday chart, there is a 1 min positive and this may lead to a gap fill, it could be traded, but this is not where the probabilities are, they are in a pullback that sees accumulation and that's where I want to be a buyer, I'm thinking the <$70 level.
If the gap is hit which it should be either way (short or longer term), here's where it is from today.
The orange area on this daily chart.
The idea is let FXP come to us on a pullback likely below the ascending trendline in the <$70 area, look for accumulation to confirm a constructive pullback and enter FXP as a longer term trend position or core position (long) short China.
I'd put this on your radar, set some price alerts around $70 as a reminder and we'll take it from there, I've been waiting for this all of 2014, China's seeming counter trend bounce looks like it will give us the opening we have been looking for this year.


No comments:
Post a Comment