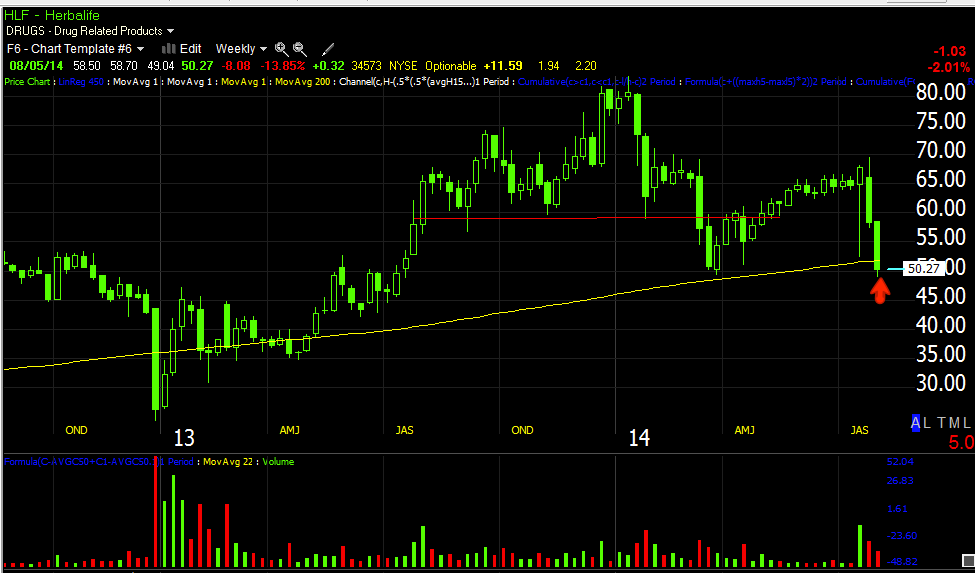
Who knows, maybe Ackman is right and HLF is going to zero as an Enron-like scam as he calls it, in any case we didn't enter HLF because of Ackman and we didn't shy away from it because of Icahn and their feud, it was all based on the charts and the concepts, especially relating to where we enter H&S tops and where we don't.
Right now the HLF equity short is at a +22% gain and really has barely broken the H&S top. I suspect in the days ahead there will be an attempt to fill some of the gap which is not my favorite entry, but I do like the short a lot and that makes it an entry worth considering for a longer term position trade.
This is the daily chart of the H&S top, they almost never look like the textbook in real life, this is one of the reasons volume confirmation is so important. Even the ones like the SPX 2010 price pattern that looked much more textbook was just random price action with no volume confirmation and a lot of traders were burnt shorting it.
As always, these are the 3 areas I'll short a H&S top and the one I won't, the head, the right shoulder, never on the break of the neckline and then after the new shorts who entered on the break of the neckline are shaken out which is where we added to the HLF partial position short on July 22nd as it was up +25.45 %,, Adding 25% to HLF Short Position, which wasn't an easy short trade to make emotionally, but the charts showed us it was the right place and time to make it.
This is the 200-day on a 5-day chart, an area of natural support and thus a likely area for HLF to bounce a bit and open up another opportunity to either start a new position or add to an existing one. I saved about 25% space in the risk management / position sizing to add a final 25% size position to fill out HLF and will likely do so on any bounce, if there's no bounce, I'll consider adding at a later date on a counter-trend rally as pyramiding up a true short position is actually a smart idea and a way in which you can make more than 100% on a short (one of the old arguments against short selling, that a stock can only go to zero and thus you can't make more than 100%, but you actually can...Making More Than 100% on a Short.
This is the daily 3C chart, it actually looks the worst at the short shakeout or the last place I'll short a H&S top. We've talked about this conceptually numerous times, but this is a chart that is giving us a real world example as the market starts to really come apart and these right shoulders and top patterns are breaking.
This is my 60 min Trend Channel which I'm just using to illustrate the slight change in character as the ROC in price is changing and starting to move more laterally, likely to build a small base from which it can bounce and thus provide another entry for those interested in HLF. I think I'm going to try to add to HLF if possible, but otherwise just let this position work and not fool around with it (overtrading) too much.
This 15 min chart of HLF shows the negative divegrence at the top of the shakeout or area #3 and the Ackman presentation rally in which HLF put in its largest 1-day gain which as I said that day, I believe was likely Icahn trying to humiliate Ackman on his big day as we saw a 5 min positive divergence, enough to make a move like the 1-day move we saw, but not enough to do much more than that.
You can see overall HLF is in leading negative position which is good, but as price starts to lose some downside momentum there's a small 15 min positive starting to build.
If you are interested in a longer term position you can just put aside and let it work for you without worrying about trading around sharp corrections, I think HLF is a great choice and who knows, maybe the company will be proven a scam and go to zero.
As always, if interested, I'd set price alerts above this area and near the gap area as I suspect we will see some bounce sooner than later, although I doubt (from what I see right now) that we'll be above the neckline again.
Is interest rates about to start going up?
-
Yes, I know - it does not make any sense - FED is about to cut
rates...but....real world interest rates are not always what FED wants it
to be.
6 years ago


No comments:
Post a Comment