There are a lot of dynamics in play re: treasuries, from the simple flight to safety to banks VERY short on high quality collateral as the F_E_D has absorbed a good portion of it through QE, rising rates and although I don't think there's enough detail out there or surety about the situation, the F_E_D has said more than once that they are no longer taking the "Hold assets on the balance sheet until maturity", but rather moving toward the idea of "Shrinking the balance sheet", which may be necessary for a couple of reasons, one being the bloated balance sheet of the F_E_D from some $850 bn before the financial crisis to $4.43 trillion dollars, the largest balance sheet expansion in F_E_D history. The Bank for International Settlements in its yearly report pointed out the US F_E_D as "Leading Central Banks" in saying that they're balance sheets are so bloated that they may not have the capacity to deal with an "Average" recession, much less another financial crisis. Another reason has been seen in month end and quarter end Financial/bank window dressing in which they used the F_E_D's 1-day reverse repo facility on April 30th to make it look like they were in far better collateral positioning than they were, of course that all went back to the F_E_D the next day after the month end report was finalized showing those "borrowed" assets as being part of their collateral, that set the second highest use of the 1-day F_E_D facility ever and on June 30th at the end of Q2 as they window dressed, 94 banks borrowed an unprecedented !/3rd of a trillion for window dressing setting a new record high use of the facility which promptly shrank the next day as collateral was returned, all to fool investors and regulators which is ironic as the banks' regulator was the one lending them the assets to falsify their financial condition.
In any case, banks are in need of high quality collateral like treasuries which the F_E_D ha absorbed.
Here's TLT, it looks like it's going to pullback,
but I don't see this as a TBT (20+ year UltraShort) trade opportunity, but perhaps a treasury pullback buying opportunity if you are looking for something very long term.
Here's the daily 3C chart of TLT (20+ year treasuries) with a positive divergence / large base in to 2014 and subsequent uptrend.
Isn't it interesting that the debate within the financial media as to "Who's right, the bond market or the equities market" has all but disappeared in to what seems to be accepted as the new normal, yet 2014 marks a very clear deterioration of market breadth with large funds like Appaloosa saying at a Financial conference in May of 2013 that they have been selling "Everything not nailed down" for 15 months, something easily verified by their filings. If they are selling equities over that period (and remember for a fund that size, a Billion dollar position in one asset would be "moderate"), what are they buying to replace them? It would seem the answer is Treasuries as you can see a clear trend of Treasuries rising as the F_E_D phases out QE and is almost done.
The longer term TLT position looks secure for more upside.
If you look at the daily chart above there's a negative divegrence coming out of the channel in late May, this shows the same negative divegrence followed by a positive divegrence (accumulating the pullback) sending TLT higher.
Currently the 60 min chart is in line so it doesn't look like there's any major downside trouble on the horizon.
The 15 min chart shows the same negative divegrence late May and positive on the accumulation of the pullback and is in line or confirmation.
Even the 10 min chart is in line or 3C/price trend confirmation.
However some nearby charts are seeing some sharper negative divegrences, here a 3 min and the 5 min is negative as well.
The 1 min trend shows the clearest underlying trend of distribution(short term or on a smaller basis) so this would indicate a TLT pullback in the making.
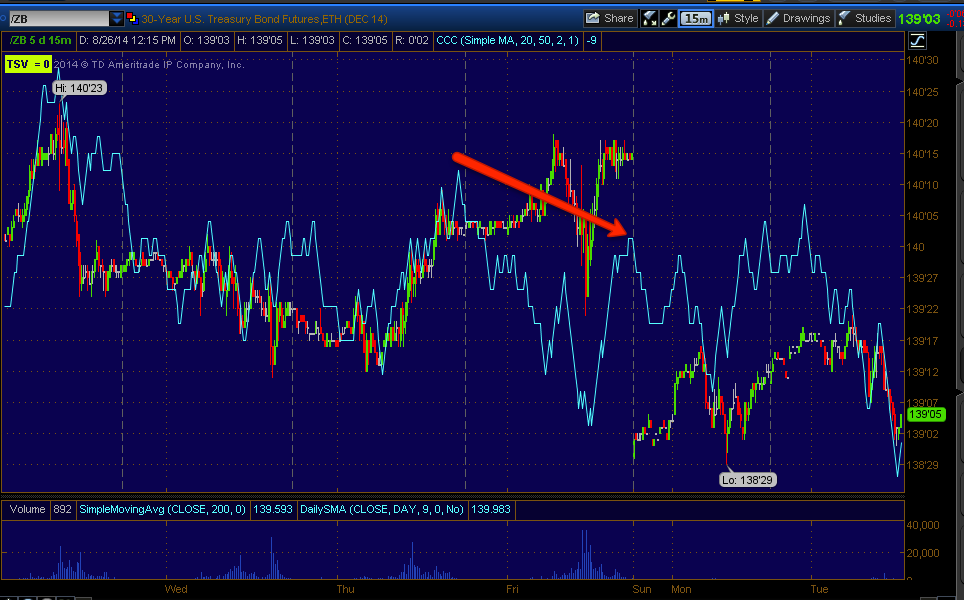
I looked at both the 30 year treasury futures above and the 10 year T futures (not posted), they both look the same.
The 60 min chart is seeing a pullback, but not going negative, as if it were accumulating lower prices which is what I suspect is happening, but I also suspect we'll see even lower prices/pullback before this is done.
The 30 min chart for 30 year treasury futures looks the same.
It's here around the 15 min mark that there has been recent distribution, I don't think the kind that is actual distribution as in trying to exit a position, but the kind that creates enough supply to create a pullback that can be accumulated in size.
The 5 min chart shows the same just as TLT and just as the 10 year Treasury futures.
As for TBT, the inverse 2x short TLT (20 + year Ultrashort), it is seeing some accumulation on the 1 and 2 min charts.
Even out to 5 mins there's a slight sign,
I would NOT take this trade long, it just doesn't have the base or divegrence, although it should move, it's just too weak of a long position for me to risk anything on, but does show confirmation of all of the above charts.
At 10 mins on TBT, it is in line with no positive divegrence, thus not worth the time.
However if you are interested in owning the long end on a pullback, I'd keep treasuries on the radar over the next several days/week.


No comments:
Post a Comment