Last week's Friday afternoon, The Week Ahead was pretty clear within the context of the way things were left off at the close Friday, the SPX was in a downtrend, for most technical traders, this means follow the trend, the trend is your friend.
Here's what it looked like.

I can only give you the probabilities based on objective data and you have to decide how you want to trade those or use them.
Here's the forecast from last Friday...
"HY Bond flows were actually positive going in to the early August base, a sign that we were probably looking at the bounce expected from the Daily Wrap of July 31st. However this week we have 765 million in HY outflows on top of last week's 198 million, in other words HY credit, just like before the August rally, is giving a tell signal again. HYG's bigger picture chart is giving the same tell signal and in the SPX we have lower highs and lower lows, but the market rarely makes it that easy.
HYG's positive divegrence this week is still there and it's not for nothing , it's not a coincidence.
While I can't pinpoint the exact moment, my guess is HYG is used to boost the market, maybe even our head fake move because the market itself just doesn't have the positive short term divergences to do it alone. However after that, I'll say HYG will be headed straight back down and I'm guessing this happens before the policy announcement on Wednesday. Judging by the scramble toward our set-up targets in several of our short set up plays today, despite a red market, it looks like they are in a hurry to get that move in place and I suspect HYG is going to help early in the week and then retreat before the market."
While most of the forecast was right on, especially coming from an established downtrend, I think the HYG divergence wasn't for the F_E_D or anything else, I think, as posted yesterday it was support for Alibaba as there is a lot of money to make in those non-locked IPO shares, nearly 1/3rd of the shares weren't locked up, which makes supporting the market to sell those shares at $90 something rather than the initial planned $6-$68, is a big difference, I figure off the top of my head, worth another $4 billion dollars.
While the timing around the F_O_M_C was not correct, just about everything else was as you saw the market all of this week, except for today, have a higher correlation to HYG more thoroughly than any other asset.
The head fake move that we have been anticipating for weeks now as the market has been in stage 3 was fulfilled as forecasted above last week. I've drawn the Igloo/Chimney so many times before it actually happened, it's pretty hard to argue against the concept that we have been expecting going on 3 weeks.

I think other aspects of that forecast are still correct although haven't happened yet, such as HYG leading the market down as it has led the market every day since August 1st, so the deterioration there is important.
You may recall I've brought up the subject of deciding how much weight to place on top-ticking position entries vs just getting in. As the big picture goes, a couple percent here or there will not make a lick of difference 6 months from now. While I think that was an important decision for each trader to make, I now think the market is giving us such a strong message, it shouldn't be ignored and in my view, it leans heavily toward, GWT YOUR POSITIONS IN PLACE, leave some wider stops/take on fewer shares, but get them in place.
I'm looking forward to seeing what the HY bond fund outflow / inflow was for the week, but it's obvious from last week, they are already preparing for something big and since them this week, nearly everything has confirmed that. I have focussed on breadth a lot, but the 16 point gain in SKEW in 2 days right after the F_O_M_C is sending a strong message. I no longer think this is a debate, but a necessity and the only debate is how to do it (whether phasing in, adjusting for wider stops by taking on fewer shares initially, etc.).
So I wanted to make sure to look at as much as I could before putting this post out, my conclusion is there's no support for this move as we never expected there to be and it's in a fragile position. If you think the IWM taking out all of yesterday's gains, all F_O_M_C gains and almost posting a new low on the week today is something impressive, wait until you see a break in the market in which weeks and sometimes months of longs are taken out on an opening gap. I think it's not a rush today to chase lower prices, I don't ever want to do that, but I think there's very little time and some assets we have already positioned in are already breaking down, Transports for instance (IYT) have put in a bearish reversal candlestick formation, and our entry is just below this area, SCTY is breaking down, HLF of course continues to work at a +30% gain since our June entry, our recent FXI short (FXP long) is looking like excellent timing on the entry, NFLX's entry has us in the green. As I said the last few weeks, different set-ups will be ready at different times, but a move down in the market is going to take most stocks with it.
Here are the charts I've been putting together the last hour, I may revise some of this after seeing the closing breadth figures, but I think the general concept is sound.


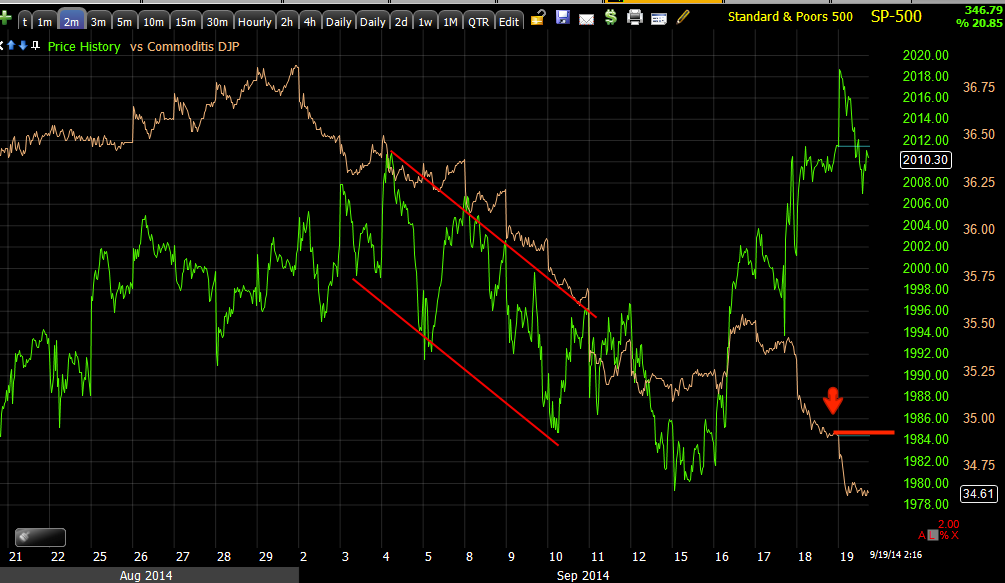
The yellow arrow is a micro version of the macro concept of a head fake move right before a stage change or reversal, they are one of the best price based timing indications and that's exactly what the "Chimney" move in the market/SPX is on a macro basis.


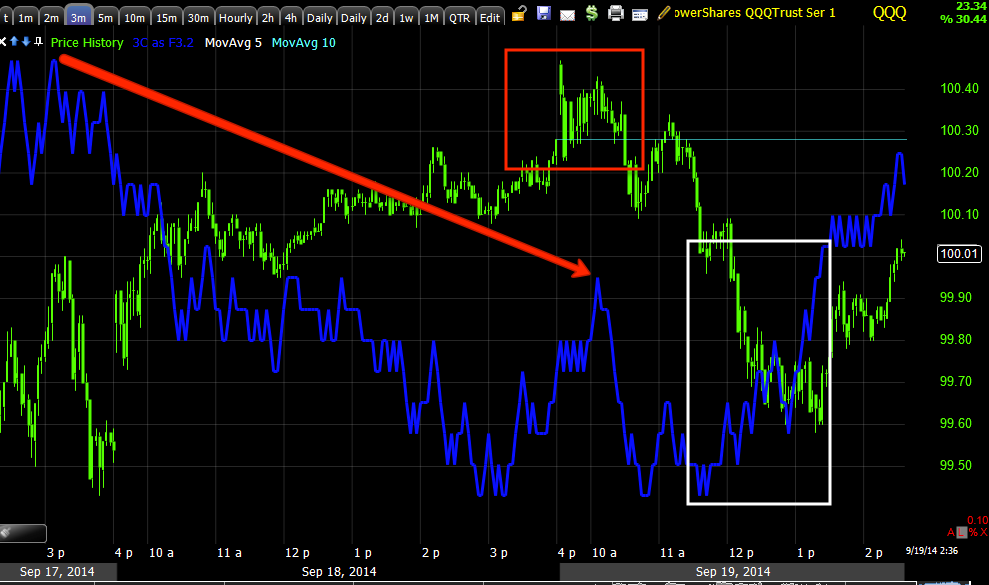
Here's the second one we use...


This should make for a nice SRTY long entry.


I suspect the Q's will try to break this flat resistance trendline before heading down, allowing a nice entry in SQQQ long.


No comments:
Post a Comment