I'll try to get GLD charts up ASAP,
but I think right now, the market is more important, this is really getting to look ugly and right in line with our head fake /Crazy Ivan shakeout expectations. The bull trap is sufficiently set.
The GLD position covered never made much progress, but rather than have it sit there as dead money being at full size, I decided to close it on some strange looking GLD activity that I no longer feel I have a STRONG edge with, I'll come back to it.
As for the market, HYG was called on intraday, presumably to halt a premature slide in equities as the European market closed.
HYG 1 min intraday, this is still a small divegrence for intraday steering only.
The effect, SPY is in green and HYG in red, you can see HYG lent the market support.
However HYG's distribution trend is still solidly intact and I would not doubt this.
Meanwhile I wondered if TLT was seeing any distribution to try to help the market (support) and none, it just keeps moving higher. ZB (30 year treasury futures also have the same positive chart as well.
Here's the result, TLT in red moving up with SPY just like the last two F_O_M_C meetings after their knee jerk reaction up and at almost the exact same time.
Meanwhile the strength in the "Flight to Safety" Bond trade is sending our leading indicator, Yields (30 year) lower, dislocating with the market even more- this is what happened at the last two F_O_M_C meetings 2-3 days after that killed the knee jerk and sent the market lower, in the first case as mentioned, to the October lows so quite a way and this is already much more dislocated on a longer term basis suggesting an even worse move which is my forecast and has been.

SPY 2 min is seeing some distribution so the HYG move is only mildly supportive, I don't think it's there for any other reason than to temporarily halt a free fall decline, whether that be because positions are still being moved around or something else,
but I don't think we have long now, possibly even overnight. There are only a few VERY short term charts I'd like to see move like the in line or close to it 1 min.
SPY 5 min accumulation before the F_O_M_C and distribution after.
That odd trade from last week in SPY for $200 million in the last 4 seconds of trade (something like 1134 trades in a single second), skews the SPY chart's scaling making it difficult to show divergences on shorter term charts where that spike is present.
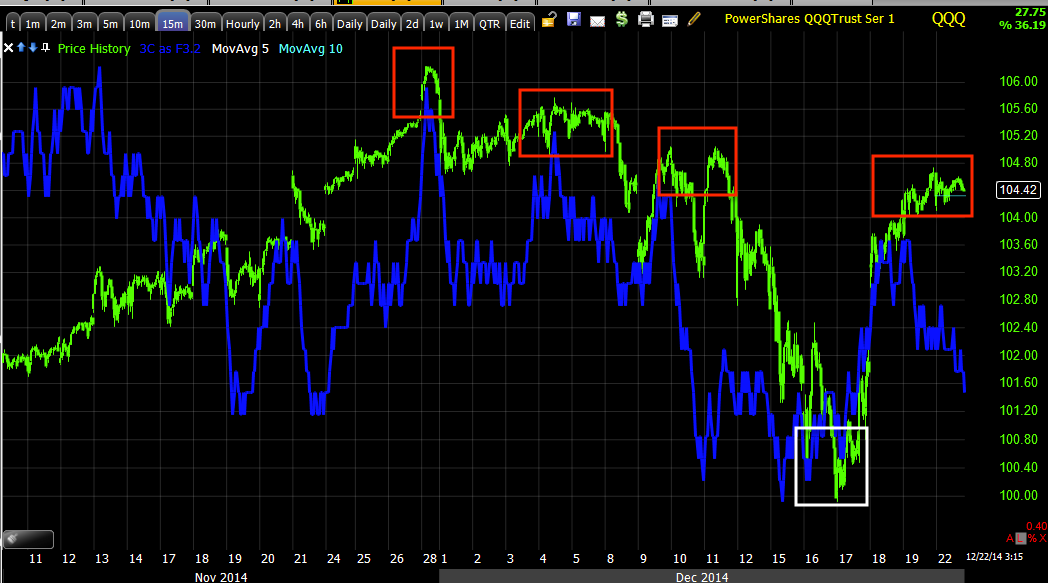
Being as such, I'll use the QQQ
The 1 min chart with late Friday's weakness that was carried over this morning and pretty much in line most of the day on a 1 min chart, there's a slight positive divegrence now, but that may be an anomaly on the chart and fade- it's of no concern to me.
The 2 min chart, beyond simple intraday steering is showing a clearer trend of negative divergences reaching deeper in leading negative position as well as the pre-F_O_M_C accumulation.
This QQQ 5 min trend chart should be
MORE THAN CLEAR, THERE IS TROUBLE HERE AND NOW.
The 10 min chart carries on the multiple timeframe migration near perfectly, there's trouble here.
THE 15 MIN CHART JUST MAKES THAT MORE CLEAR, ESPECIALLY BEING A STRONGER 15 MIN CHART.
And this move was never meant to hold, the highest probability 60 min chart has been leading negative in a large stage 3 top, no head fake move is going to repair this damage, as I said, it was never meant to hold.
As for the IWM, all the important timeframes are moving along like the Q's.
Intraday the 1 min continues better relative strength, but it's just a steering chart of no real consequence beyond intraday reversals., etc.
5 min leading negative
10 min seeing the migration from shorter charts and leading negative.
Remember we called this from the start as being the average that would show the best relative performance.
I won't say we are right there, but I think we are darn sure close enough that I would not be trying to thread the needle.


No comments:
Post a Comment